 0
0The iconic image of faraway galaxies, and one of the most-observed regions of space, has just received a spectroscopic upgrade.
The Hubble Ultra Deep Field — that iconic image peppered with faraway galaxies — just got a whole lot deeper.
The tiny square in Fornax that the Hubble Space Telescope stared at for almost 12 days in 2003 became the sharpest, most sensitively recorded region of the sky. Now, the Multi Unit Spectroscopic Explorer (MUSE) on the European Southern Observatory’s Very Large Telescope in Chile has taken the image one step further.
MUSE also revealed 160 new distant galaxies, including 72 previously undetected in Hubble’s images. Not only that, but the instrument sharpened our measurements of all the galaxies’ distances. Ten papers in a special issue of Astronomy & Astrophysics reveal the implications for the formation and evolution of stars and galaxies across cosmic time.
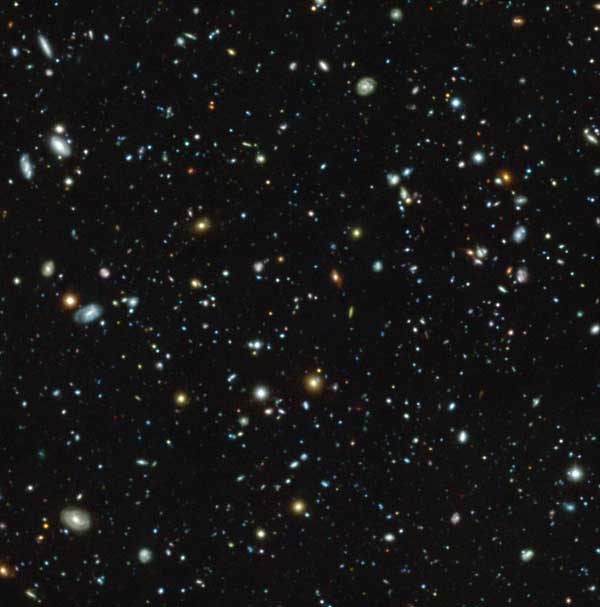
ESO / MUSE HUDF collaboration
Spectroscopic Upgrade
If a picture is worth a thousand words, then a spectrum is worth a thousand pictures. Splitting a galaxy’s light into its component colors reveals the motions within, the stars it bears, and — most importantly, especially for cosmologists — the galaxy’s exact distance.
Over the years follow-up observations with ground- and space-based telescopes have expanded the Hubble Ultra Deep Field (HUDF) to many other wavelengths, including radio, infrared, near-infrared, ultraviolet, and X-rays. Astronomers have used this multi-wavelength abundance to estimate the redshifts, and hence the distances, of 9,927 galaxies. The youngest of these live in a universe just 600 million years old.
But these redshifts were not exact measurements — that would require a spectrum for each galaxy, and spectroscopic follow-up is difficult when the targets are thousands of faint galaxies overlapping in a tiny region of sky. So astronomers have largely gauged distances by comparing galaxies’ brightness in broad-wavelength bands to the brightness expected from typical galaxies at that distance. Such estimates, known as photometric redshifts, aren’t precise enough to see if two galaxies lie close to each other in space, for example.
MUSE allowed a different approach. Rather than take one spectrum at a time, Roland Bacon (Lyon Centre for Astrophysics Research, France) led the MUSE-HUDF Survey team in taking everything’s spectrum, all at once. Known as integral field spectroscopy, this technique produces a three-dimensional “data cube” by measuring a spectrum for every single pixel in an image.
After 137 hours on the telescope, MUSE increased the number of galaxies with spectroscopic redshifts by nearly an order of magnitude: from 161 to 1,338 galaxies.
These precise distances will have reverberations throughout the fields of star formation and galaxy evolution. Emmy Ventou (University of Toulouse, France) and colleagues, for example, used this data to identify 113 close pairs of galaxies distributed across 12 billion years of cosmic time.
They show that the rate at which galaxies merge increases until roughly 2 billion years after the Big Bang, after which it subsides — a pattern that echoes the peak of star formation in the early universe. The authors plan to study the connection between merger rate and star formation in future studies.
Finding Galactic Dust Bunnies
MUSE also enabled astronomers to find galaxies that had evaded previous detection. Faint, low-mass galaxies pervade the early universe like so many dust bunnies, but even though they’re teeming with newborn stars, they emit most of their radiation at a single wavelength, known as Lyman alpha.
Hubble’s direct imaging missed many of these objects. MUSE caught 692 of them — including 72 new ones that Hubble had not detected — because astronomers were able to slice apart the data cube, searching the HUDF specifically for strong Lyman-alpha emitters.
As Alyssa Drake (then at University of Lyon, France) and colleagues show, these diminutive galaxies had an important role to play — they could have single-handedly lit up the young universe during what is known as the epoch of reionization.
Astronomers are also using the MUSE observations to investigate hydrogen-rich gas haloes around faraway galaxies, galaxy-scale winds and their connection to star formation, and rotational velocity curves of even very distant galaxies.
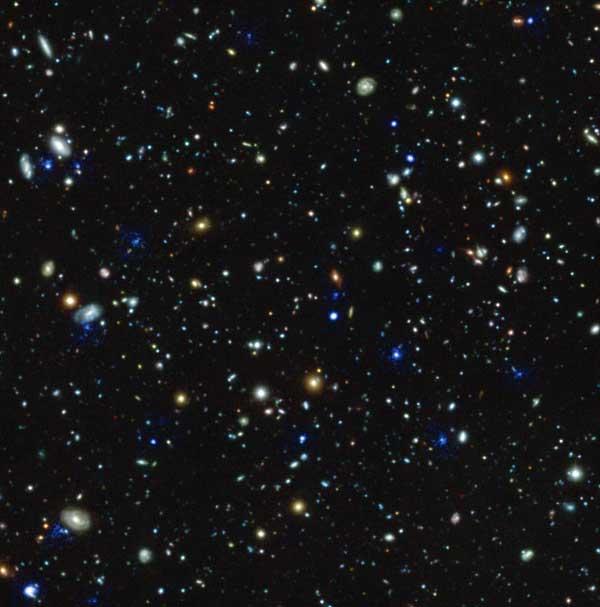
ESO / MUSE HUDF team
You can explore more of the results in the following papers (links here are to the pre-prints of the articles published in Astronomy & Astrophysics):
- Bacon et al. “The MUSE Hubble Ultra Deep Field Survey: I. Survey description, data reduction and source detection”
- Inami et al. “The MUSE Hubble Ultra Deep Field Survey: II. Spectroscopic Redshift and Line Flux Catalog, and Comparisons to Color Selections of Galaxies at 3 < z < 7”
- Brinchmann et al. “The MUSE Hubble Ultra Deep Field Survey: III. Testing photometric redshifts to 30th magnitude”
- V. Maseda et al. “The MUSE Hubble Ultra Deep Field Survey: IV. An Overview of C III] Emitters”
- Guérou et al. “The MUSE Hubble Ultra Deep Field Survey: V. Spatially resolved stellar kinematics of galaxies at redshift 0.2 ≲ z ≲ 0.8”
- B. Drake et al. “The MUSE Hubble Ultra Deep Field Survey: VI. The Faint-End of the Lyα Luminosity Function at 2.91 < z < 6.64 and Implications for Reionisation”
- Finley et al. “The MUSE Hubble Ultra Deep Field Survey:VII. Fe II* Emission in Star-Forming Galaxies”
- Leclercq et al. “The MUSE Hubble Ultra Deep Field Survey: VIII. Extended Lyman α haloes”
- Ventou et al. “The MUSE Hubble Ultra Deep Field Survey: IX. evolution of galaxy merger fraction up to z ≈ 6”
- Hashimoto et al. “The MUSE Hubble Ultra Deep Field Survey: X. Lyα Equivalent Widths at 2.9 < z < 6.6”


Comments
You must be logged in to post a comment.