 0
0Two projects are mapping the distribution of dark matter in the universe, probing scales both large and small.
Anatoly Klypin (NMSU), Joel R. Primack (UCSC), and Stefan Gottloeber (AIP, Germany)
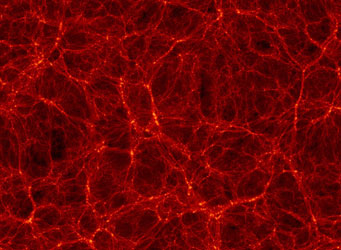
Observations show the universe to be a cosmic spider web: galaxies and clusters of galaxies are strung along its nodes and filaments like so many caught flies. Yet the thread — dark matter, which makes up 85% of the universe’s mass — is largely invisible, fully visualized only in simulations.
Scientists are finding ways to map this unseen backbone of the universe, plotting its effect on light coming from distant galaxies and even from the remnant glow of the Big Bang, the cosmic microwave background.
Two projects making the invisible visible are the Dark Energy Survey, led by Josh Frieman (Fermilab) and conducted at the Cerro Tololo Inter-American Observatory in the Chilean Andes, and the Atacama Cosmology Telescope polarization survey, also in Chile and high in the Atacama Desert. These complementary surveys are taking on the universe on scales big and small.
Mapping Superclusters and Supervoids

Dark Energy Survey
Frieman’s team is tackling the large-scale universe using the Dark Energy Camera, a 570-megapixel CCD camera that’s in the process of surveying a huge, 5,000-square-degree swath of Southern Hemisphere sky. (Compare that to the cutting-edge yet still-measly 16-megapixel camera in a Samsung Galaxy S6 smartphone!)
Using preliminary data that covers just 3% of the full survey, a team led by Vinu Vikram (Argonne National Laboratory) examined the shapes of more than 1 million faraway galaxies, whose light has traveled between 5.8 billion and 8.5 billion years to reach us. The team was looking for the smearing effect of intervening dark matter.
Dark matter’s gravity acts like a lens to magnify and distort the galaxies’ light, but its effect is weak — individual galaxies vary enough in shape that the gravitational lensing isn’t noticeable. The key is quantity: measure enough galaxies and the smearing becomes plain.
Vikram and colleagues measured the smearing to construct a two-dimensional dark matter map, plotting out how much dark matter lies along lines of sight within a 139-square-degree area.
Since the map traces normal, luminous matter (galaxies and galaxy clusters) as well as the now-visible dark matter web, astronomers can use it to study the connection between the two. Galaxies and clusters don’t exactly trace the underlying dark matter distribution, since normal and dark matter follow different physical laws, so knowing how the two differ is essential for puzzling out longstanding mysteries.
Mapping Galaxies’ Dark Matter Halos
M. Madhavacheril & others
After viewing the grand, 500-million-light-year scales of the Dark Energy Survey results, which still only hint at the mammoth survey to come, zooming into recent observations from the Atacama Cosmology Telescope (ACT) is like taking a sip of the shrinking potion in Alice in Wonderland.
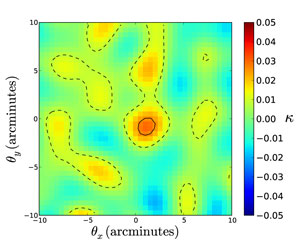
The ACT dark matter maps focus on a scale of a mere 3 million light-years, roughly the size of a dark matter halo around an individual galaxy. Graduate student Mathew Madhavacheril and his advisor Neelima Sehgal (both Stony Brook University) led a team in measuring dark matter’s smearing effect, not on the light from faraway galaxies, but on the most well-traveled light in the universe: the cosmic microwave background (CMB).
ACT’s polarimeter spent 3 months surveying the glow from photons freed 380,000 years after the Big Bang at a frequency of 146 GHz (corresponding to a wavelength of 2 millimeters). Even though this glow is “bumpy,” varying in brightness from one spot to the next, it’s actually pretty smooth on the arcminute scales probed by ACT. But a million-light-year-wide hunk of intervening dark matter will distort the light and create sharp changes in brightness on these small scales.
The team looked for such brightness changes and found about 12,000 that matched up with galaxies listed in a Sloan Digital Sky Survey catalog. Each of these galaxies has a massive halo roughly 10 times that of the Milky Way. Stacking all the ACT images together, the team created an image of an average dark matter halo.
Simply measuring the signal from galaxies’ dark matter halos is an accomplishment — little has been done on these small scales before. The average dark halo’s mass and concentration, as measured from this blobby image, so far match what’s expected from dark matter simulations. The same technique will be applied to the Advanced ACT polarization survey taking place between 2016 and 2018, which will cover ten times the sky area. Eventually, Madhavacheril hopes to trace the growth of dark matter halos over cosmic time.
Preliminary as they are, these maps pave the way for understanding dark matter’s role in the universe, including its structure, its connection to ordinary matter, and its role in the evolution and fate of the universe.
Tour the universe from the near to the very, very far in Deep Space: Beyond the Solar System to the Edge of the Universe and the Beginning of Time, the newest book available from S&T's Contributing Editor Govert Schilling.


Comments
You must be logged in to post a comment.