 4
4Back when I first took statistics, I was impressed by how reliably and scientifically you could measure something as seemingly uncertain as uncertainty. Statistics was all about quantifying uncertainty — the "statistical" kind of uncertainty, that is. . . not the kind about whether or not she really loves you. Or about whether you maybe bumped the photometer on the back of the telescope with your elbow, so that all of its readings are off systematically.
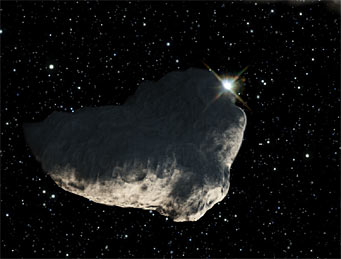
An artist's concept of an asteroid occulting a very bright star as seen from close up.
NASA / ESA / Greg Bacon (STScI)
This comes to mind because researchers mining Hubble Space Telescope data have announced — by relying heavily on bit-by-bit statistics — that they have detected the smallest Kuiper Belt object yet observed.
In the December 17th Nature, Hilke Schlichting (Caltech) and her colleagues report finding the signature of a star being briefly occulted by something, as seen by one of Hubble's Fine Guidance Sensors (FGSs). The three FGSs watch selected guidestars to provide high-precision navigational information to Hubble's attitude controls. The group searched 12,000 hours of FGS data for signs of any star briefly disappearing.
The researchers found just one apparent case, lasting about 0.3 second. (The FGSs sample a star's light 40 times a second.) However, it wasn't a clean disappearance and reappearance like the asteroid occultations that amateurs often seek to observe. The occulting object was apparently so small, and so far away, that the event was dominated by the diffraction pattern the object imposed on the starlight passing around it, as shown in the graph below.

The occultation event, which lasted about 0.3 second, was dominated by diffraction fringes rather than showing a sharp disappearance and reappearance of the star. The blue dashed curve is a theoretical best-fit diffraction pattern for the event. The pink squares are the sums of the theoretical blue curve that would be seen in each 1/40-second time interval binned by the instrument. The centers of the red lines are the actual photon counts recorded in each time interval. The red bars show the statistical confidence of the photon count (at the 68% level) above and below each data point. That is, there's a 68% chance that the true value for the point would fall within the red bar. The authors claim that overall, there's only a 2% likelihood that such a pattern would happen anywhere in their data just by chance.
H. T. Schlichting et al.
By assuming that the object was in a circular orbit, the group was able to estimated its distance based on the duration of the occultation. They came up with a distance of about 45 a.u., similar to the mean distance of Pluto and many other Kuiper Belt objects from the Sun. Also, the amount of diffraction-dimming gave an estimate of the object's size: about 1 kilometer (0.6 mile) across.
All of this — even whether an occultation really happened at all — depends on close statistical analysis of the graph above. The center of each red error bar is the star's observed brightness during an interval 1/40 of a second long. The error bar extends one standard deviation (in statistics talk, one sigma) above and below each point.
How well do these match the theoretically predicted pink squares, overall? Pretty darn well, the authors say. They find only a 2% chance that a correlation this good would happen in the FGS data by chance.
But that could depend on various assumptions, and other specialists are not yet convinced. And there have been other claims of momentary Kuiper Belt occultations in the past that did not pan out on closer analysis.
If this finding is true, it matters, because of another statistical inference. Finding one object 1 km in diameter in a data set this size indicates a dearth of small Kuiper Belt objects compared to what would naturally be expected from the number of large ones. This, in turn, suggests that small Kuiper Belt objects get ground down by the same kind of collisions that are creating dust rings around some other stars, in the stars' own Kuiper-Belt-like zones. When it comes to small-number statistics, one data point is about as small a number as you can get — but it does tell you something.
To try to find more occultations, the team plans to analyze the remaining FGS data for nearly the full duration of Hubble's operations since its launch in 1990.
For more information, see the group's paper.
About Alan MacRobert
Alan M. MacRobert became an avid Sky & Telescope subscriber in 1966 at age 14, joined the editorial staff in 1982, and is now a senior contributing editor, semi-retired. He played a role in practically every part of the magazine and the company's other products for more than a generation, both on the amateur-observing side and the science-reporting side. In 1994 a book collection of his observing how-tos and telescopic sky tours was published as Star Hopping for Backyard Astronomers. He has produced This Week's Sky at a Glance online every week since 1989.

Comments
Dennis F. Hyde
December 25, 2009 at 2:41 pm
I am continually amazed at the beauty and clarity of the photos taken by Hubble. Will be a sad day when this great telescope meets its demize. Hope there is something in the works to replace it.
You must be logged in to post a comment.
WR
December 26, 2009 at 8:42 am
Hi
Statistics also says that with the shown 23 measurements 3.8 of them should lie above the +/- 1 sigma range and 3.8 should lie below the +/- 1 sigma range (in each case ~ 1/6th of the measurements). This rule of thumb is not really harmed by the shown measurements. Effectivly they base there result on 3 measurements that would else have to be rejected as outliers.
If they find only a 2% chance that a correlation this good would happen in the FGS data by chance and they searched 12000 hours of FGS data (giving nearly half a million data points), I would wonder if they wouldn't find such an appeart event that looks real just by chance.
All in all I'm pretty sceptical if this is a real event and not just normal noise that by chance looks like a real event.
The Nature paper can be read via:
http://adsabs.harvard.edu/abs/2009Natur.462..895S
http://arxiv.org/abs/0912.2996
Merry Christmas
WR
You must be logged in to post a comment.
WR
December 26, 2009 at 11:34 am
Hi
When looking at Fig. 1a of the paper and deriving the mean and stddev from the +2 and -2 sigma lines (7.3 measurements each of the 160 measurements in the 4 sec data set above and below the +/- 2 sigma band) one can derice a mean of ~ 150.8 counts +/- ~ 10.8 counts for the stddev. This stddev is about in the correct range as the uncertainty bars in the above plot and Fig. 1b of the paper.
But the model in the 0.6 sec data set around "mid eclipse" in the above plot and Fig. 1b of the paper assumes a significantly higher "uneclipsed mean" of ~ 157.5 counts. This is IMO not OK.
Its IMO strange that the actual measurements were not as obviously marked as the calculated model "measurements" as their difference actually define the goodness of fit of the model.
Further the last measurement in time was omitted in the above plot and Fig. 1b of the paper although there is enough space to show it. With ~ 125 counts it would have been considered as an other outlier and would have made the plot much less convincing. Doinmg so is IMO not OK either.
CS
WR
You must be logged in to post a comment.
Richard
December 29, 2009 at 8:53 am
Video-taping asteroid occultations has been a fascinating hobby of mine for the past several years. I use my hand made 16" Newtonian reflector, GPS time base and a QIWI On Screen Display unit to time these events to +/- 17 milliseconds. I am always amazed how such difficult predictions can actually be made with the precision that I have found to be the case.
I do have a question on the portion of the article quoted below:
"By assuming that the object was in a circular orbit, the group was able to estimated its distance based on the duration of the occultation. They came up with a distance of about 45 a.u., similar to the mean distance of Pluto and many other Kuiper Belt objects from the Sun. Also, the amount of diffraction-dimming gave an estimate of the object's size: about 1 kilometer (0.6 mile) across."
If the distance, speed, and size of an unseen object are unknown, is it really possible to calculate all three of these parameters with any reasonable degree of accuracy?
I thought the only way ordinary asteroid occultations provide the size of the objects, is the fact that the distance and speed are pretty well known. Therefore, the length of time of the occultation provides a clue to the size of the object. Multiple observations are still required to prevent certain ambiguities.
Am I missing something here?
You must be logged in to post a comment.
You must be logged in to post a comment.