 3
3Observing the pattern of flickers in a star’s light offers a new way for astronomers to measure one of the basic properties of stars — and any exoplanets they might host.

In this series of images of the solar surface from the Hinode spacecraft, granulation due to convective cells can be seen surrounding a sunspot.
When you look through a telescope at a star glowing red, you might ponder: is it skinny or fat?
Although so-called red dwarfs and red giants have the same temperature, the distinction between them is profound. Red dwarfs are half the mass of the Sun or smaller. A red giant can be many times the mass of the Sun. It’s also about to die — low on energy, it’s bloated to as much as 1,500 times the radius of the Sun.
Astronomers can tell the difference between dwarfs and giants by measuring the strength of the star’s gravity at its surface. High surface gravity indicates a stable, healthy star in the prime of its life. Low surface gravity means the star has swollen in old age.
Unfortunately, surface gravity is devilishly difficult to measure. One hint is the width of dark lines imprinted in a star’s spectrum by elements in the stellar atmosphere as they absorb certain wavelengths of outgoing light. (Wider lines means a higher surface gravity: the higher pressure jostles the atoms, which can then absorb a broader range of light due to one of quantum physics’ many bizarre effects.) However, this method is only accurate to about 25–50%. Another rough estimate comes from a star’s mass and radius, which in turn are estimates from measurements of the star’s brightness. But like a passing phrase in a game of telephone, this chain can result in errors as large as the measurements themselves. It’s possible to measure gravity via “starquakes” — which can give accuracy to within 2%! — but this method only works for the very brightest stars.
When Vanderbilt astronomer Fabienne Bastien began analyzing data from the NASA Kepler satellite for her dissertation, she wasn’t expecting to find an answer to this problem — she was researching how changes in a star’s brightness are linked to its magnetic field. But when she brought a plot to her advisor Keivan Stassun, they realized their team had found an entirely new way to measure the surface gravity of fainter stars, with accuracy better than 25%.
The new method uses what the team calls a star’s “flicker.” This effect is due to bubbles of hot, bright, gas that rise to the star’s surface and then cool, dim, and sink just a few hours later in a convective loop. This overturn causes small changes in the star’s brightness; how quickly it happens depends on how strongly the star’s gravity pulls material back into its depths.
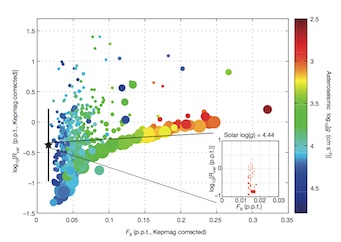
In this information-rich plot (click to enlarge), the vertical axis is the size of a star's brightness variations and the horizontal axis is the amount of "flicker" due to granulation. A young star begins its life at the top left of this diagram, with large changes in brightness due to starspots. But as a star ages, starspots subside and it moves down and slightly to the right of the diagram. When it's magnetically quiet, it hits the "floor" of the diagram and doesn't leave, shuffling off to the right as it swells. The team calls this part of the diagram the "flicker sequence." The changing surface gravity, which was measured by astereoseismology, is indicated by the changing color. (The size of the symbols indicates the complexity of the light curve, measured by how many times it crosses its own median.) Interestingly, the amount of the Sun's flicker varies widely over its 11-year activity cycle (shown by the black star and bars at the lower left). At solar minimum, it approaches the flicker floor.
In a young star, the flicker is rather weak and overshadowed by fluctuations in brightness due to starspots. These usually rotate in and out of view on timescales longer than eight hours. But as a star ages, its magnetic activity subsides, spots disappear, and the granulation flicker comes to the fore. As the star swells to become a red giant, its surface gravity weakens and the flicker strengthens dramatically. By observing a star’s brightness continuously — as the Kepler mission did — astronomers can measure its flicker. And by comparing to flicker measurements of stars with known surface gravities measured by asteroseismology, it is possible to determine the surface gravity from only the flicker measurements, the team reports in this week’s issue of Nature.
You can actually hear this process when the stellar light curves are converted into sound waves. In these representations from Nature Video, you can hear the high-frequency “hiss” of the flicker become louder as the star ages.
Surface gravity is an indicator of how wide a star is, but it isn’t just crucial for stellar astronomers — exoplanet researchers are excited, too. “Because planetary transits measure the relative area of the planet and star, our knowledge of the size of the planet is only as good as our knowledge of the size of the star,” says Lucianne Walkowicz (Princeton), an astronomer not involved in the study. If a star’s estimated size goes down, then so does the planet’s —potentially making it more likely to be rocky and habitable. “So this is a really clever way of using the Kepler data to take characterization of the stars (and any planets) a step further.” Also notable about this discovery is how the team made it. Instead of writing their own software to look for correlations in the massive Kepler data set, they first used an online tool developed at Vanderbilt called Filtergraph. This free and open website allows anyone to upload huge data sets to share — upwards of millions of data points — and quickly visualize them. “I think the beauty of Filtergraph is that it lets you ‘play’ with the data — that’s essentially what led us to this discovery,” said Bastien. It’s intuitive and fast, which allows scientists to explore their data “at the speed of thought,” says Stassun, who contributed to its development. “This discovery is just the type of discovery that we created Filtergraph to enable. We had no preconceived notion about the flicker-gravity correlation, and we might never have uncovered it without the ability to quickly and intuitively ‘see’ the data en masse.” References Bastien et al. “An observational correlation between stellar brightness variations and surface gravity.” Nature, 22 August 2013. http://dx.doi.org/10.1038/nature12419

Comments
Bruce Mayfield
August 21, 2013 at 6:17 pm
This is a very neat new tool for stellar characterization, but something rather astounding that wasn’t discussed in this article literally pops out of the “information-rich plot” graphic. The plot contains an inset that plots the range our Sun goes through during its 11 year solar cycle, and its average is marked with the black star on the main chart. Notice that our star falls completely outside the range of this set of Kepler stars! I would have naively thought that the Sun would fall somewhere inside the spread of this study’s sampled stars, but it doesn’t. Is the Sun really that unique? Was Kepler unable to find a single truly unlike star? That would be remarkable.
You must be logged in to post a comment.
Mark Zastrow
August 22, 2013 at 10:12 am
Hi Bruce, good question! The reason the Sun appears at the edge of the range of data is that the plot represents only the subsample of Kepler stars that have highly accurate gravities determined by astereoseismology — the brightest stars, which tend to be more massive and more evolved (with more flicker) than the Sun.
The authors note that the observed correlation does extend all the way down to the Sun and very accurately predicts the Sun's actual gravity, which bodes well for the relation's usefulness for main sequence stars.
You must be logged in to post a comment.
Anthony Barreiro
August 22, 2013 at 7:56 pm
This is an exciting, elegant, and promising finding! As a happy byproduct of the search for exoplanets, we are discovering much more detail about the stars those putative planets presumably orbit. The Nature video is quite informative. One particularly satisfying aspect of this study is that Bastien, Stassun, and their colleagues looked at actual data from real stars, rather than spending all their time twiddling with supercomputer models of how they think stars should behave. I hope and trust we will learn a lot more about stars and planets from Kepler's accumulated observations.
You must be logged in to post a comment.
You must be logged in to post a comment.