 0
0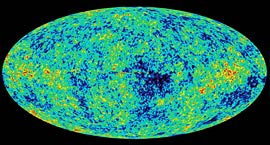
The cosmic microwave background (CMB) is leftover radiation from the Big Bang redshifted (stretched), by the universe's expansion, into the microwave region of the spectrum. In this image NASA's Wilkinson Microwave Anisotropy Probe (WMAP) records minuscule temperature differences in the CMB as different colors. The hotter and cooler spots evolved into the clusters of galaxies and giant voids seen in today's universe.
All images courtesy NASA / WMAP Science Team.
For three years the scientific community waited with bated breath for new results from NASA's Wilkinson Microwave Anisotropy Probe (WMAP). It appears it was worth the wait. The WMAP science team announced today that it found powerful new evidence to support the prevailing cosmological model in which the universe experienced an explosive growth spurt within its first trillionth of a trillionth of a second — a fleeting moment of hyperexpansion known as inflation. During this interval, the volume that contains today's entire visible universe probably increased by a staggering 1060 times (that's a 1 followed by 60 zeroes) or more, from extremely submicroscopic to perhaps the size of a golf ball.
Most cosmologists have embraced inflation since it was proposed in 1980, because the model beautifully explains profound mysteries about our universe, such as why it has so few magnetic monopoles (hypothetical particles with only a north or south pole) and why different regions of the universe look pretty much the same despite the fact they have been out of physical contact. But most of the evidence for inflation could be described as successful "postdictions" rather than "predictions." In other words, inflation has been a convenient theory because it explained things that were already known. The essence of a really good scientific theory, however, is one that makes predictions that later turn out to be true.
WMAP has changed the game by confirming some of inflation's boldest predictions about the afterglow of the Big Bang, the cosmic microwave background (CMB). The CMB is the white light of the Big Bang, stretched and cooled into the microwave part of the spectrum by cosmic expansion. The CMB is a veritable gold mine of information about conditions in the universe moments after its birth. Specifically, its temperature varies from place to place by 0.00001° Celsius; these fluctuations represent regions where the early universe had a slightly greater or lesser density of matter. WMAP results announced in 2003 confirmed ground- and balloon-based measurements showing that the strongest of these temperature variations are about 1° wide on the sky, in spectacular agreement with inflation's predictions.
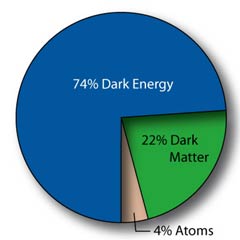
WMAP data reveals the universe's ingredients. The universe is made up of 4% atomic matter (the stuff that planets and people are made of), 22% dark matter (a mysterious form of matter not made of atoms or known particles), and 74% dark energy (an even more enigmatic form of energy that is causing the universe's expansion to accelerate). These results are in close agreement with those from numerous other astronomical studies.
But today's announcement takes this science to a new level. With three more years of data, the WMAP team was able to refine the map of these temperature variations, enabling the team to make more precise statements about the age and contents of the universe. The new results say that the universe is 13.7 billion years old with an uncertainty of only 2%. The results also yield the ingredients of the cosmic recipe: 74% of the universe's matter-and-energy density is in the form of dark energy (the unknown energy that is causing cosmic expansion to accelerate), 22% is dark matter, and 4% is the familiar type of matter made of atoms, which forms stars, planets, and people. These numbers are very similar to those released in 2003, but are more accurate thanks to the better data. They are also in close agreement with numerous other astronomical observations using different methods, such as measurements of the universe's expansion derived from observations of Type Ia supernovae.
"It's wonderful how the different experiments support each other and confirm each other," says Chuck Bennett (Johns Hopkins University), leader of the WMAP science team. "It gives us the warm feeling that we're on the right track. We have so much data with cross-checks and interlocks that you can pull out the results of any experiment and get the same answer."
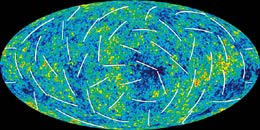
With 3 more years of WMAP data, scientists have produced a more detailed picture of the infant universe. Colors indicate warmer (red) and cooler (blue) spots. The white bars show the polarization direction of the oldest light. This new information helps to pinpoint when the first stars formed and provides new clues about events that transpired in the first trillionth of a second of the universe. Click on the image to view a larger version.
More importantly, the WMAP satellite detected the extent to which the CMB's microwave photons were polarized during their long journey across the universe. Ground-based experiments have also detected polarization, but only across small areas of sky. WMAP measured it across the entire sky. The team was then able to use the polarization measurements to subtract contamination signals from the first stars that formed in the universe, which created a cosmic fog that confuses the signature of inflation. The team's analysis shows that the first stars started this process about 400 million years after the Big Bang.
By combining the polarization measurement with the new and improved temperature measurements, the team pinned down a number known as the "scalar spectral index" to a value of 0.95, with an uncertainty of only 2%. This number compares the CMB temperature fluctuations seen over large scales to those seen at small scales. Ground-based experiments are incapable of making this measurement because they're limited to small angular scales. The simplest inflationary models predict that the scalar spectral index should be slightly less than 1, which is exactly what the WMAP team has found.
The new data also help cosmologists close in on the nature of dark energy. Dark energy is the unknown force, not predicted by modern physics, that acts as a sort of negative gravity on large scales and is causing the expansion of the universe to speed up — a fact that has been known only since 1998. The new WMAP data, combined with other astronomical findings, narrow down dark energy's "equation of state," a number known as w, to a value of –1 with an accuracy of about 10%.
What this means is that dark energy behaves like Albert Einstein's "cosmological constant" — it's an inherent property of space-time itself, as opposed to some unknown kind of particles or field in space (which theorists have dubbed "quintessence") that thin out as space expands. In other words, a cubic centimeter of space contains the same amount of dark energy no matter how much space expands throughout cosmic history — unlike the photons and gas particles in space, which thin out as the universe enlarges.
Previous measures of w were good to about 15% accuracy (Sky & Telescope: June 2004, page 16). If w is fixed at –1, it means the cosmos will never be destroyed in a runaway super-expansion ("Big Rip") or re-contraction ("Big Crunch").
"Great News"
Mosts scientists in the field have reacted positively to these new WMAP results. "This is great news for inflation," says University of Chicago cosmologist Sean Carroll, who is not a member of the WMAP team. "You're looking for a number that is close to one, but it still not equal to one in a statistically significant way."
"This is big news, indeed. Most alternatives to inflation do not predict a scalar spectral index less than one," adds Anthony Aguirre, a University of California, Santa Cruz cosmologist who is also not a member of the WMAP team. "I will feel more confident once a second group has analyzed the data and obtained similar results. This should not take very long. In the meantime, I am fairly confident, however, as this team has been quite careful."
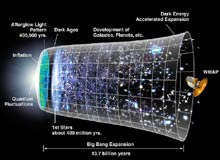
This timeline symbolizes the expansion history of the universe over its 13.7 billion years of existence. The expansion experienced an extraordinarily rapid spurt in the first moments of the universe's history; since then it has been relatively gradual. But over the past few billion years, it has begun to speed up due to the influence of a mysterious 'dark energy.' Click on the image to view a larger version.
WMAP team member Lyman Page (Princeton University) agrees. "In the simplest models, inflation said that it should be something like 0.95. Intellectually it seems very clear, clean, and nice. We don't know if inflation is right, but it sure smells like it's right."
The WMAP result will allow scientists to distinguish between the many different models of inflation — some of which do not predict a value of 0.95. This, in turn, will help them in their quest to understand exactly when inflation started and ended, and why it happened at all. "This result is winnowing the field of contenders," says Columbia University physicist Brian Greene. "This will help us understand the details of how inflation took place."
Princeton University theorist Paul Steinhardt, who helped pioneer inflation in the early 1980s, calls the WMAP result "a milestone achievement." He says theorists have spent years developing more exotic types of inflation models that require new fields or fine-tuning mechanisms. "This milestone means that many of these exotic ideas are out the window, which cleans up the field a lot," he says. But he also points out that the new WMAP results are consistent with another idea that he helped develop: that our universe occasionally collides with another universe in higher-dimensional space-time, leading to endlessly repeating cycles of Big Bangs and expansion. WMAP team members agree that this cyclic model is consistent with their results, and that a next-generation satellite is needed to determine which model, if either, explains our universe.
For more details about inflation, see the cover story of Sky & Telescope's November 2005 issue.

Comments
You must be logged in to post a comment.