 0
0Deep-sky observers prefer skies that are both cloudless and crisp (transparent, in astronomer’s jargon) to maximize the contrast between faint objects and their surroundings. This article is a practical guide to some websites that can help you forecast when and where you will find transparent skies, to plan your observing sessions better. For a more complete discussion, see "Clear(er) Skies Ahead," by Phillip J. Creed, in Sky & Telescope's August 2008 issue. See also our Web article on Transparency and Atmospheric Extinction.
Basics
If you click on one of the squares in the Clear Sky Chart forecast, it opens the underlying continent-wide forecast from the Meteorological Service of Canada.
Source: Clear Sky Chart
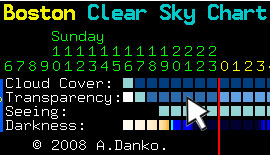
Many regular stargazers are familiar with the Clear Sky Chart, which forecasts cloud cover, transparency, and seeing (air steadiness) for thousands of locations across North America. Each square in a Clear Sky Chart forecasts is color-coded to show the forecast for one particular hour at the selected location. If you click on one of these squares, it displays the underlying continent-wide forecast from the Meteorological Service of Canada. So if your favorite site is likely to be clouded out, you can look for better spots nearby. Less obviously, the map provides critical information about the forecast's reliability that isn't apparent when looking at one of the site-specific forecasts.
This excerpt from the transparency map shows that the area of good transparency around Boston is relatively small.
Meteorological Service of Canada
For instance, judging by the Clear Sky Chart shown above, Boston's transparency should be pretty good all evening. But if you look at the associated map at right, you'll see that the clear area is relatively small. So a small shift in weather patterns might cloud you out. But if the entire Northeast were dark blue, you could have pretty high confidence that Boston would be OK.
Useful as they are, the Clear Sky Chart and the underlying Canadian forecast have a serious shortcoming: they explicitly ignore air pollution, which is a major contributor to hazy skies, especially in the summertime.
Aerosol Optical Depth
Haze is a reduction in visibility caused by aerosols:microscopic solid or liquid particles suspended in the atmosphere. Aerosols have many sources both artificial and natural. The most important sources for North America are power plants, motor vehicles, forest fires, dust storms, and volcanoes.
Humidity exacerbates the effects of air pollution, because aerosols tend to swell as they soak up any available water vapor. But air that's both humid and clean, like that found in many tropical islands, can be crystal clear.
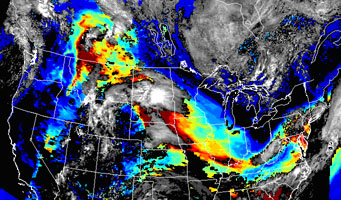
This MODIS image shows smoke from a forest fire in the northern Rocky Mountains spreading across the United States. The next night was nearly useless for deep-sky observing in the upper Midwest despite a veru promising transparency forecast from the Clear Sky Chart.
Tony Flanders
Several satellites monitor haze from outer space. Most important to North American stargazers are the Moderate Resolution Imaging Spectrometer (MODIS) instrument on the Terra satellite, and the Geostationary Satellite Server Aerosol and Smoke Program (GASP). MODIS takes one detailed image ever day, and GASP is updated every half hour during daylight hours. They measure aerosol optical depth (AOD), which is closely related to atmospheric extinction. An AOD below 0.2 is good enough for most deep-sky work, up to 0.4 is satisfactory for bright star clusters and planetary nebulae, and anything above that means a very poor night for deep-sky observing.
The IDEA website should be the first stop for North American stargazers who want to see how haze events are unfolding across the continent. This site contains current and archived data from MODIS and GASP. GASP images are also available from NOAA's Satellite Services Division.
The Total Ozone Mapping Spectrometer (TOMS) instrument measures both ozone and aerosols on a global basis. This can be useful because aerosols major forest fires, dust storms, and volcanic eruptions frequently cross from one continent to another and occasionally spread worldwide.
Ground-Level Haze
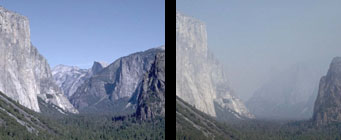
Here's Yosemite Valley on a clear day in October 1982 and a smoggy day one week later. The US National Park Service has been a leader in the fight against air and light pollution.
Improve Project
Satellite data is extremely useful, but it has limitations. For instance, satellites can't measure air pollution at ground level when the sky is overcast. That makes it hard to guess what the skies will look like when the clouds move away. There are several websites that measure ground-level visibility, possibly combined with satellite data.
HazeCast forecasts ground-level visibility across the US and southern Canada. This website also explains haze's causes and effects.
The National Park Service, the Midwest Hazecam, and (for the northeastern US) the CAMNET website all have live webcams showing air quality at selected locations.
Other Websites
The Smog Blog is an online daily discussion of air quality issues in the U.S.
VIEWS (the Visibility Information Exchange Web System) is perhaps the most thorough website for the study of long-term visibility trends.
The National Weather Service Air Quality Forecast features maps for both ozone and smoke concentration.
AERONET (Aerosol Robotic Network) is an international network of ground-based stations that sample aerosol optical thickness. Both real-time and long-term AOD climatology are available.
Looking forward to the future, CAIR, the Clean Air Interstate Rule issued by the US Environmental Protection Agency, should reduce air pollution in the eastern US dramatically, leading to significant improvements in transparency, especially during the summer.

Comments
You must be logged in to post a comment.