 4
4Hidden within the subtle hues of the stars are the keys to their temperatures and compositions. Get acquainted with the classic OBAFGKM spectral sequence through real stars you can see on a spring night.
Pschemp / Wikimedia Commons / CC BY-SA 3.0
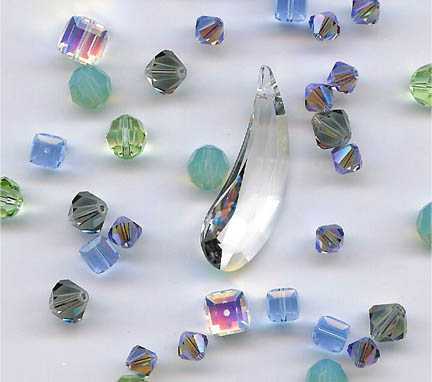
Color has always been a source of wonder for me. I recall the shimmery, refractive colors of my grandmother's rhinestone jewelry when I was a child. To this day, cut glass catching the sun still makes me ooh and aah. At night, stars substitute for rhinestones. Their colors may be more subtle, but they flare with the same clarity and fire.
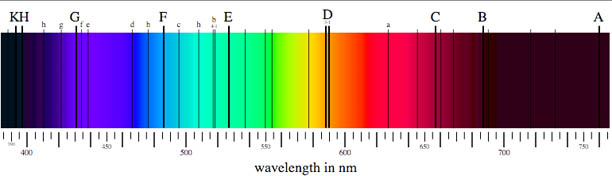
When it comes to stars, color contains valuable information about temperature and composition. English chemist William Wollaston passed the Sun's light through a prism in 1802 and discovered it was crossed by fine, dark lines. He assumed they were natural boundaries between the colors. German optician Joseph Fraunhofer measured and cataloged 574 such lines in the early 1800s still known to this day as "Fraunhofer lines".
Not until the early 1860s, when English astronomer William Huggins matched some of the dark "absorption" lines in the Sun's spectrum with those in terrestrial substances, did astronomers come to understand that stars are composed of familiar materials, not some exotic fifth element, or quintessence, as Aristotle had thought.
Bob King
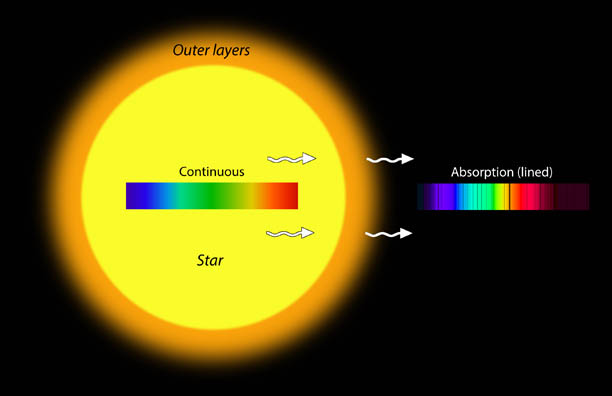
Hot, dense objects like the tungsten filament in a light bulb or an electric stove burner give off every color of light and emit a line-free, continuous spectrum that looks like a rainbow. A star is likewise hot and dense and produces a continuous spectrum. But before that light reaches your eyes, it must pass through cooler, less dense gas in the star's outer layers. There, atoms in the gas absorb specific colors of light, leaving narrow gaps or lines in the spectrum.
Public Domain
Atoms and molecules in a star's outer envelope reveal their identity by the patterns of lines they produce. Every single element and compound produces its own unique set. Since nearly every star displays absorption lines, astronomers could use the patterns they saw in solar and stellar spectra as "fingerprints" to probe their composition.
Smithsonian Institution
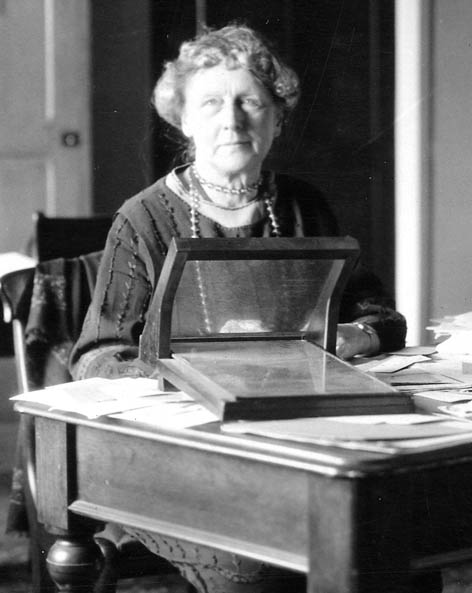
Different stars show different spectra. Some have only faint lines, while others are missing chunks of color. By the late 19th century, astronomers were developing schemes to classify spectra The most prolific classifier, Annie Jump Cannon, worked as an assistant to Harvard College Observatory director, Edward C. Pickering, and created a catalog of 325,300 stellar spectra by the early 1920s. Simplifying earlier, more complicated schemes, Cannon divided stars into seven categories, each of which was assigned a letter.
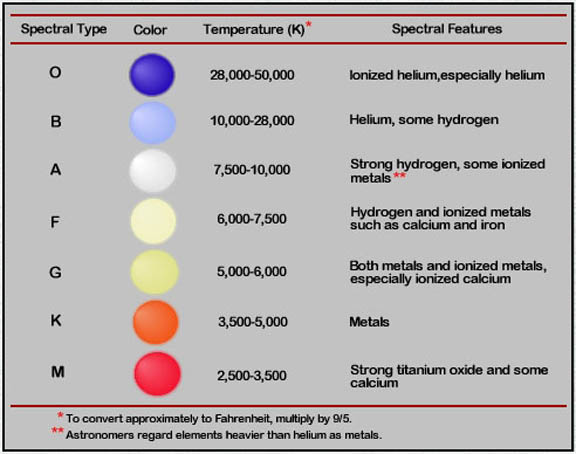
Although not fully understood at the time, her prescient ordering classified stars according to their surface temperature, from the hottest blue-white supergiants to the coolest red dwarfs using this letter sequence: O B A F G K M.
To help us remember the order of this unpronounceable acronym, someone, possibly Cannon herself, proposed the mnemonic "Oh, be a fine girl, kiss me!", which has since morphed into the more egalitarian "Oh, be a fine girl/guy, kiss me!" If that doesn't suit you, consider these others found while trawling the Web:
Only bad astronomers feel good knowing mnemonics
Only boys accepting feminism get kissed meaningfully
Oh boy, another Ferengi getting Klingon money
Odysseus begged Athena for guidance killing many lusty Trojans (this one includes the new L and T dwarf classifications)
One brutal astronomer fought gnarly karate monsters
I could go on but ...
Stellarium; Diagram: Bob King
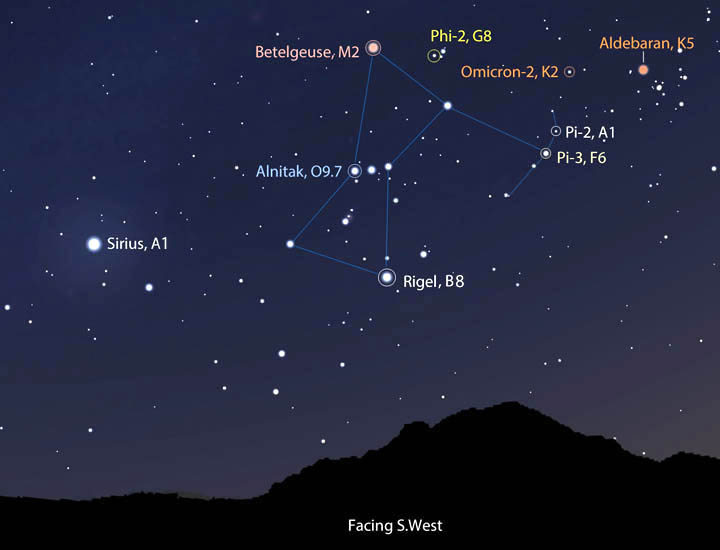
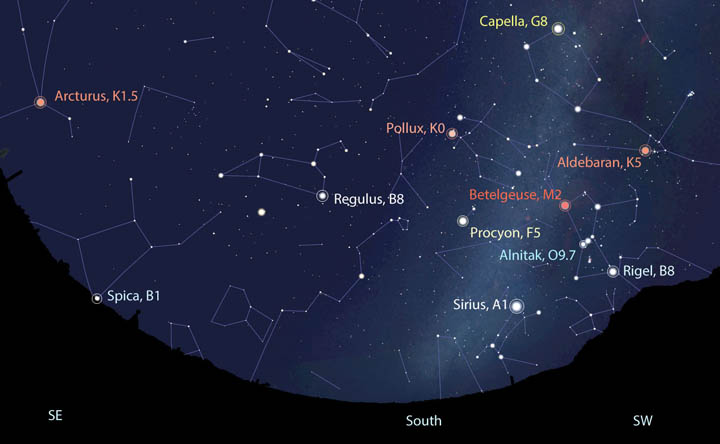
Another way to remember and appreciate the colors of the spectral classes is to get acquainted with the real stars behind the letters. The early spring sky offers up naked-eye stars of all seven spectral types. I've included two maps to help you find them. One shows all seven within the bounds of a single constellation, Orion. The other highlights only the brightest representatives across many constellations.
Stellarium; Diagram: Bob King
Temperatures across the classes range from 50,000K (90,000°F) for massive O stars like Alnitak in Orion's Belt to 5,780K (10,000°F) for the sun and down to 2,500K (4,000°F) for the coolest supergiants. As far as staying chill, Betelgeuse, with a surface temperature of around 3,200K (5,300°F), is the coolest, easily-visible star on early April evenings.
Eugene R. Zizka
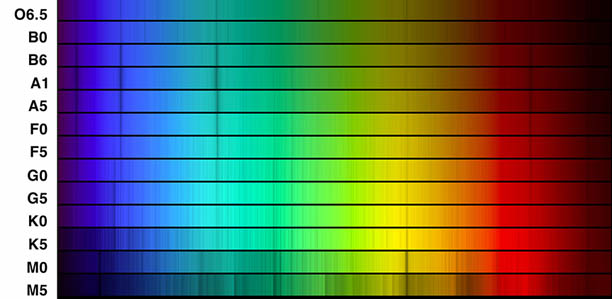
Each class is subdivided into 10 subclasses, numbered from 0 to 9 (our Sun is a G2 star with characteristics part-way between G and F). Further, temperature defines which atoms and molecules show up in a star's spectrum. In blazing O stars, searing heat ionizes helium, a very tough thing to do, since the gas holds its electrons tightly and is loathe to part with them. Spectra of cooler M stars are blanketed by familiar atomic absorption lines of "metals" (elements other than hydrogen and helium) and molecular lines from titanium oxide, carbon molecules, and even water.
NOAO / AURA / NSF
All this you can see with your own eyes using a visual spectroscope. I have a Rainbow Optics model that does a great job showing the classic hydrogen Balmer line absorptions in Sirius and Vega (A-stars) and the lush banding in Betelgeuse. When you realize you're seeing the internal workings of atoms hundreds of light years away, it almost feels like touching a star.
Rhinestones. The wonder of color goes deeper than we ever imagined.
About Bob King
I love the sky (day and night) and have been a skywatcher and amateur astronomer since childhood. I'm also a long-time member of the American Association of Variable Star Observers (AAVSO) and Astronomical League. I pen the Astro Bob blog and have written four books: Night Sky with the Naked Eye (2016); Wonders of the Night Sky You Must See Before You Die (2018) and Urban Legends from Space (2019) and Magnificent Aurora, published in 2024. The universe invites us on an adventure every single night. To accept the invitation, we only need look up.

Comments
Anthony Barreiro
March 30, 2016 at 2:47 pm
Thanks Bob, this is a masterful lesson in stellar spectroscopy and classification, and I love how you relate this rather arcane subject to casual naked-eye skywatching. You're tempting me to buy a spectroscope! I may not be able to see faint galaxies and nebulae from my urban back yard, but I can certainly see bright stars.
One thing that I think bears mentioning: All the cool M and K stars that are bright enough to be seen by the naked eye are giants, and the very bright A and F stars are nearby.
Only bad astronomers feel good knowing mnemonics -- indeed.
You must be logged in to post a comment.
Bob KingPost Author
March 30, 2016 at 4:24 pm
Hi Anthony,
Great point about M and K stars and A and Fs. Thank you! I think you'd enjoy a spectroscope. Other star worth looking at with one are bright Mira variables (rich with lines/bands) and novae. I saw emission in Nova Delphini a couple years back. The emission spectrum of Gamma Velorum is also quite striking. The limit for seeing clear spectral features in the Rainbow Optics through my 10 and 15-inch scopes is around mag. 4. Much smaller scopes show absorption lines, too but only in the brightest stars.
You must be logged in to post a comment.
Aqua4U
April 3, 2016 at 3:41 pm
I can't help but notice that since our star has a G2V classification it's spectral lines are dominated by ionized metals, especially Calcium, whereas the A and F stars are on the hotter side of our classification and the K and M stars are on the cooler side of our classification, but all of these stars contain the metals necessary for life as we know it.. Therefore, 5 out of 7 star classifications appear to provide the metals we've found are necessary for life as we know it. I wonder. shouldn't this factor be included in the Drake equation?
The Drake equation is: N= R* X fp X ne X fl X fi X fc X l but with spectral analysis might be construed: N= R* X fp X ne X fl X fi X fc X l / S*, where S* is the spectral type?
N = the number of civilizations in our galaxy with which communication might be possible (i.e. which are on our current past light cone); and
R* = the average rate of star formation in our galaxy
fp = the fraction of those stars that have planets
ne = the average number of planets that can potentially support life per star that has planets
fl = the fraction of planets that could support life that actually develop life at some point
fi = the fraction of planets with life that actually go on to develop intelligent life (civilizations)
fc = the fraction of civilizations that develop a technology that releases detectable signs of their existence into space
L = the length of time for which such civilizations release detectable signals into space
You must be logged in to post a comment.
April 5, 2016 at 1:36 pm
Hi Bob-
Nice article, very reminiscent of one I wrote for my own blog! I had even constructed a sorted series of spectral types like the NOAO version you ran... Being an optics type, I made an objective prism that I used in front of my 300mm lens for the spectra in my post. I found that I can work to the faintest star I can see visually in my central Tucson back yard (about 4th or 5th magnitude). Currently working on a 6" version to run on my TEC 140 for stellar spectra and also for monochromatic images of emission-line objects. It is amazing what you can do with an inexpensive piece of glass and off-the-shelf cameras and optics. Keep looking up!
-Dean
You must be logged in to post a comment.
You must be logged in to post a comment.