 2
2Harvard College Observatory is digitizing its famed collection of more than 500,000 glass sky-survey plates and has just released the first data set.
I walk past row after narrow row of dark green filing cabinets. Each one, I know before I peer inside, is filled with hundreds of astronomical glass plates in paper sleeves: old-fashioned photographic negatives of the night sky. A typical plate holds 50,000 stars in its delicate emulsion coating. Most are nearly as big as an ordinary sheet of paper — and thin enough to be pretty fragile.
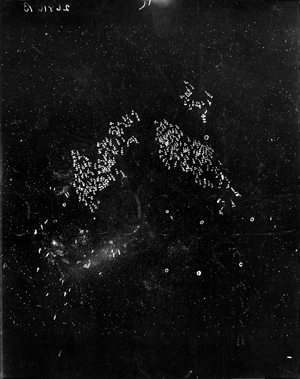
The Large Magellanic Cloud, imaged on December 18, 1900 in Arequipa, Peru, contains annotations from Henrietta Leavitt, referenced in her logbooks during her research on Cepheid stars. (Click for bigger image.)
Harvard College Observatory
The collection of more than 500,000 plates fills an old brick building on Harvard’s Observatory Hill in Cambridge, Massachusetts. Here is preserved roughly a century of information about faint happenings across most of the celestial sphere. For more than a lifetime, astronomers have come from around the world to examine these plates — one by one on light tables under magnifiers — for the histories of the innumerable objects they contain.
For a long time, breaking one of these glass plates meant destroying data — there was no backup. Some of the sleeves contain two or more pieces of broken glass. Nor was there a way to access this data without traveling to Harvard and spending a lot of time fetching, handling, and refiling.
But that’s changing even as I step down the tight spiral staircase to yet another floor of the Harvard College Observatory Plate Stacks. I’m following Alison Doane, the current Curator of Astronomical Photographs, on a tour of three floors of irreplaceable sky history. She opens a cabinet to show me rows and rows of plates in sleeves. On each sleeve, cursive handwriting in fountain pen records the plate’s position, date, and other information. She carefully pulls out the plate she’s looking for and walks back to a lightbox.
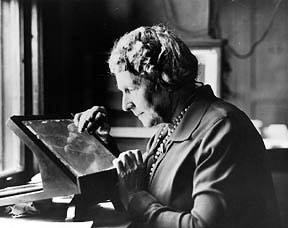
Annie Jump Cannon demonstrates the wooden frame and magnifying loupe that women at Harvard used to examine the glass plates at the end of the 19th century. By the time this picture was taken in the 1930s, glass plates would have been examined with the aid of a light box.
Harvard College Observatory
This is how astronomers of old examined the plates, she explains, handing me a magnifying loupe that I would normally associate with jewelers. The stars she shows me are breathtakingly tiny: black specks on a light-gray sky. On this particular plate, small notations in ink are written on the plate itself next to some stars. These are magnitudes and identification numbers written by Harvard’s famed women astronomers who examined these plates in detail starting in the late 19th century, after Edward C. Pickering began Harvard’s project of imaging big swaths of sky every clear night. The plate collection runs from roughly 1890 to 1990.
Examining the plates the old-fashioned way is fun at first but slow, and for a large project it becomes massively time-consuming and tedious. We expect better in the digital age. So Doane leads me yet another level deeper, to the basement, for the tour’s grand finale. In what looks like a darkroom, Assistant Curator David Sliski carefully places a plate on a digital scanner that's slowly working its way through all 500,000. Built under the guidance of Bob Simcoe of the Amateur Telescope Makers of Boston (ATMoB), the instrument is specially designed for high-precision scanning. It measures the position on the plate of each tiny star speck to half a micron, and measures its brightness with an average uncertainty of 0.1 magnitude. The finished project will amount to a petabyte (1 million gigabytes) of data.
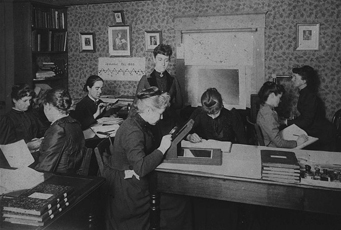
Williamina Fleming stands at the center of Harvard's women computers circa 1890, several of whom are studying glass plates with magnifying glasses and a microscope.
Harvard College Observatory
In an ironic reversal of the work done a century ago, when the plates were taken at night and processed during the day by women “computers,” the plates are now put in the scanning machine by hand during the day (nominally 400 every day). At night, modern computers take over. They use the measured stars to identify and fit a custom coordinate grid across each plate to account for all distortions, and then determine each star’s sky position and its brightness — while also taking into account the different photographic emulsions used, the different telescopes, exposure times, and observing conditions. The project has relied on ATMoB volunteers, as well as Alison Doane, professional astronomers, technicians, and funding from the National Science Foundation and private donors.
The project is called the Digital Access to a Sky Century at Harvard (DASCH). In early May it released its first dataset. After years of development, followed by scans of more than 45,000 plates (most of them during the last two years of “production scanning”), anyone can now access a 100-year light curve of any bright object within 15° of the north galactic pole. This data release also includes test fields elsewhere: around the quasar 3C 273, the Beehive open cluster (M44), Baade’s Window near the galactic center, the field of the Kepler planet-hunting mission, and the Large Magellanic Cloud.
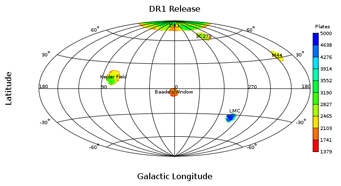
The first data release (DR1) covers the area within 15 degrees from the north galactic pole, plus five additional regions.
Harvard College Observatory
A typical star of blue magnitude 12 or 13 offers a light curve of about 1,500 points. Astronomers have already discovered a new type of stellar variability, long-term dimming of a certain type of giant star, and much more. The century of data allows researchers to detect slow variations over decades, something otherwise impossible with today’s digital data — putting data online, after all, is only a recent innovation.
Even with about 90% of the scanning yet to go, Jonathan Grindlay, DASCH’s project leader, hopes to finish by 2016. But that goal depends on funding. The National Science Foundation gave DASCH two grants to enable development and the first data release, and DASCH is now depending on NSF funding to keep going. Grindlay expects to find out in June whether the next dataset (an additional 15° away from the north galactic pole) will be released in October as planned.
About Monica Young
Monica Young, a professional astronomer by training, is News Editor of Sky & Telescope.

Comments
Michael Hamburg
May 18, 2013 at 1:56 pm
I take great pride in playing a very small part in DASCH. I have been a docent at the American Museum Of Natural History in the Rose Center for Earth and Space since 2001. For nearly half that time I and a few colleagues have been transcribing those carefully penned logbooks into spread sheets for DASCH. It has been an interesting window into the work those women at Harvard worked so hard at. The work continues.
You must be logged in to post a comment.
Doug
June 21, 2013 at 9:36 pm
That's a very cool thing you've been doing. By reading the notes it's like going back in time.
You must be logged in to post a comment.
You must be logged in to post a comment.