 13
13Astronomers have found a gap between "real" and "failed" stars.
What does the smallest star look like? This question is deceptively difficult to answer. Stars spend most of their lives fusing hydrogen in their cores, a prime time of life called the “main sequence.” As you go down the scale of stellar sizes on this sequence, stars become dimmer, cooler, and less massive. But determining the absolute properties of the smallest stars — their mass, radius, temperature, and overall light output — is challenging for at least three big reasons.
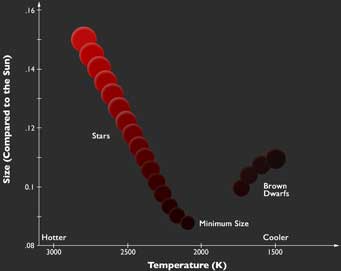
This diagram shows the relation between size (compared with the Sun) and temperature (kelvin) for stars and brown dwarfs. As astronomers suspected, there's a clear gap between where stars end and brown dwarfs begin. Click here for zoom.
P. Marenfeld & NOAO / AURA / NSF
First, these stars are extraordinarily dim: even the brightest low-mass stars produce only a few percent of the light seen from the Sun. Second, their atmospheres are very cool, meaning many types of molecules can survive there. Those molecular species make the stars’ spectra much more difficult to understand than those of their high-mass counterparts. And last but not least, the smallest stars have colors and brightnesses similar to the largest “failed stars,” which astronomers call brown dwarfs.
Brown dwarfs are lightweight objects, generally not more than eight percent of the Sun’s mass. They do not have enough mass to create the high internal temperatures and pressures needed to sustain nuclear fusion in their cores.
For objects with surface temperatures near 2,000 K (or about one-third that of the Sun), discriminating between stars and brown dwarfs has been extraordinarily difficult. Now, new results accepted for publication in the Astronomical Journal point to a clear demarcation between “successful” and failed stars.
Sergio Dieterich (Georgia State University) and colleagues assembled a wealth of data on 63 nearby low-mass stars and brown dwarfs. The team meticulously measured distances to each of the objects, along with their colors in multiple optical and infrared wavelengths. Combining the distances, colors, and brightnesses in each wavelength filter, they were able to estimate each object’s temperature, radius, and luminosity by comparing it with expectations from cutting-edge models of what stars look like on the main sequence. The astronomers verified their method by comparing their computed sizes with a handful of radii measured directly using very long-baseline interferometry, a technique that allows astronomers to link telescopic observations together to achieve high-resolution measurements.
A star’s (or a brown dwarf’s) radius is related to its brightness and its surface temperature. Dieterich’s team examined the radius-luminosity and radius-temperature distributions, searching for a gap in sizes that would mark a break between the smallest stars and the largest brown dwarfs. Astronomers expect this gap to exist because although stars and brown dwarfs’ radii are related to their luminosities and temperatures, they’re related in opposite ways: if you increased the mass of a star, it would respond by growing in size; a brown dwarf would shrink.
And the search turned up a gap. “We see that radius decreases with decreasing temperature, as expected for stars, until we reach a temperature of about 2,100 K,” says Dieterich. “There we see a gap with no objects, and then the radius starts to increase with decreasing temperature, as we expect for brown dwarfs."
“We can now point to a temperature (2,100 K), radius (8.7% that of our Sun), and luminosity (1/8000th of the Sun) and say, ‘The main sequence ends there,’” coauthor Todd Henry (Georgia State University) adds. “And we can identify a particular star (with the designation 2MASS J0513–1403) as a representative of the smallest stars.”
Determining the boundary between brown dwarfs and stars is not only interesting to those who study these objects, but it is also important in searches for new exoplanets. Low-mass stars have become increasingly attractive targets for planet searches for many reasons. They are common, long-lived, and have habitable zones nestled closer around them than more massive stars do, often making any planets within those zones easier to detect. But brown dwarfs cool with age, so they would make poor hosts to planets — just imagine what would happen on Earth if the Sun became 20% cooler every 100 million years! Planet hunters can use these new results to ignore any brown dwarfs masquerading as small host stars, limiting their searches to systems with planets that could actually be habitable for several billion years.
Reference: S. B. Dieterich et al. "The Solar Neighborhood XXXII. The Hydrogen Burning Limit." Astronomical Journal, in press.
About John Bochanski
John Bochanski is a physics professor at Rider University in Lawrenceville, NJ. John uses large surveys of the sky to study its coolest members, from nearby low-mass stars and brown dwarfs, to some of the most distant red giant stars ever discovered.

Comments
Peter Wilson
December 23, 2013 at 5:16 pm
Interesting. If the surface temperature of a contracting cloud of gas exceeds 2,100 K, it can be said, “We have ignition.”
You must be logged in to post a comment.
Bruce Mayfield
December 26, 2013 at 8:51 am
And if it never reaches 2100 K it sputters for a while on impulse (Lithium) power.
You must be logged in to post a comment.
GIbor Basri
December 27, 2013 at 1:30 pm
Both the article and the above comments are cool.
I note that age is as big a factor on brown dwarf temperatures as mass (and much more so than radius). Thus there are brown dwarfs that fill the gap in the diagram and even crawl up the stellar sequence when they are young enough. The "lithium test" is needed to distinguish those from true stars. These authors are not looking at young regions (just very nearby) and so are not bothered by them. The result is valid and cool because it is the stars which have a stable and mostly age-independent radius-mass-age relation; it is that which comes to a "cool" end at the bottom of the main sequence and has been measured in this paper.
You must be logged in to post a comment.
Anthony Barreiro
December 27, 2013 at 1:39 pm
(Doesn't that sound like a nice title for a Christmas story?) This is an important finding. It makes sense that as a star's mass increases its volume and radius would also increase, because there would be greater outward pressure from faster hydrogen fusion. A brown dwarf, without fusion, would have no force to keep it from collapsing under the increasing force of gravity. Do I have that right? Just for fun I looked for 2MASS J0513–1403 on a star chart. It should be between Kappa and Mu Leporis. I wonder how bright it is, and how big of a telescope one would need to see it?
You must be logged in to post a comment.
Peter
December 28, 2013 at 7:57 pm
Not sure about that, Gibor. The chart is confusing because temperature is graphed from hot to cold, whereas star formation proceeds from cold to hot. If it is massive enough, nuclear fusion begins, and the temperature suddenly jumps...to at least 2,100 K. Brown dwarfs never get to that point, so they never get hotter than about 1,800 K, and when they age, they cool and move to the right in the diagram. There can be no dwarfs in the gap, so no test is needed.
You must be logged in to post a comment.
Sergio Dieterich
December 28, 2013 at 9:15 pm
This is Sergio Dieterich, lead author of this study. Gibor Basri is absolutely right (as he usually is!) on his comments about radius and youth. If you look at Figure 11b of the paper, there is actually what seems to be a higher radius sequence above the main sequence that is likely formed by the few young objects in the survey.
Peter, stellar formation actually evolves mostly from hotter to cooler temperatures. This is because what dominates the temperature budget at that phase is the release of gravitational energy during pre-main sequence contraction.
dieterich at astro dot gsu dot edu
You must be logged in to post a comment.
Sergio Dieterich
December 28, 2013 at 9:25 pm
Anthony Barreiro, note that there is a typo in the press release. 2MA 0513-1403 should be 2MA 0523-1403. It is only 10 minutes, so the general constellation position you got is still right. We used the 0.9m (36 inch) telescope at Cerro Tololo Inter-American observatory in Chile (pictures at http://www.recons.org) to observe it. It is an extremely faint 21.05 magnitude in V (green light), which required 20 minute exposures with a CCD. Even with the most powerful telescopes, I don't think you would be able to see it with an eye piece because you would not have the benefit of long integration times. If you would like a finder chart, I can send you one. Drop me a note at dieterich at astro dot gsu dot edu
You must be logged in to post a comment.
Bruce Mayfield
December 29, 2013 at 11:21 am
Thanks for answering these questions directly Sergio Dieterich, and for the work you and your fellow professionals are reporting in this paper. Finding the limits of natural phenomena is always important, and this work will no doubt help astronomers improve stellar modeling. I enjoyed reading your paper. But no doubt like Anthony, who wanted to see the littlest star for himself, I was a bit disappointed to read that 2MA 0523-1403 is so faint. I was hoping that this star would be within the range of the Gaia mission, so that its characteristics could be nailed down even tighter. Also, I was wondering, since in general the lighter the stellar class, the more examples exist, can we expect that this trend continues all the way down to this bottom y’all have discovered? Will there be many more stars like this one?
You must be logged in to post a comment.
Sergio Dieterich
December 29, 2013 at 5:09 pm
Bruce Mayfield,
Because the magnitude scale is logarithmic, sometimes we forget just how faint things can get. Increasing the magnitude by 1.0 is equivalent to making an object 2.5 times fainter, and every subsequent increase of 1 unit makes THE PREVIOUS VALUE 2.5 times fainter. It is generally accepted that under dark clear skies the human eye can just reach 6th magnitude. 2MA0523 is 15 magnitudes fainter than that. Doing the math, that means about ONE MILLION times fainter than what can be seen by the naked eye. You are right that GAIA will not reach these faint objects (the GAIA cutoff is roughly 20th magnitude), but there is really nothing that GAIA can do that cannot also be done from the ground for individual stars. GAIA wins in the fact that it can do billions of stars, and not in detailed studies of a single star. For instance, we were able to get a lot of color information necessary for determining temperature from the ground. That is something GAIA would not be able to do even if the target was brighter. Right now the consensus is that the trend of more stars with fainter luminosities peaks at slightly more massive stars, and that there is a rather sharp fall-off after that. So while we expect to find a few more nearby stars like 2ma0523, they are certainly not a lot of them. We know form the WISE survey that stars appear to outnumber brown dwarfs by about 6 to 1, and it could be that a similar ratio is also representative for very low mass stars. We don't really know the shape of the drop-off yet. Several groups, including ours, are working on it.
You must be logged in to post a comment.
Bruce Mayfield
December 29, 2013 at 6:34 pm
Thanks again for those answers, and may your team have clear skies for your continuing work Sergio.
You must be logged in to post a comment.
Anthony Barreiro
December 30, 2013 at 8:21 am
Sergio, thank you so much for taking the time to respond to our questions. I now know a bit more about our littlest stellar cousins. No need for a finder chart, it's enough for me to know that 2MASS J0523-1403 is between Kappa and Mu Leporis. Somehow I find this work heartwarming, beyond its importance in establishing a fundamental physical parameter. I had the pleasure of hearing Gibor Basri speak about brown dwarfs to our local astronomy club (SFAA) a few months ago.
You must be logged in to post a comment.
Peter
January 1, 2014 at 12:50 pm
Thanks, Sergio. It’s certainly counterintuitive that a star cools down when nuclear fusion begins! Is fusion ignition like a prologue to the red-giant phase, where the star’s surface area increases, thus radiating more energy at the same time it cools? Also, we have before-and-after pictures of SN 1987a, a star death; could we do the same for star birth? Will we ever see a new star where old photos show a Bok globule?
You must be logged in to post a comment.
Bruce Mayfield
January 6, 2014 at 6:05 am
Having such a clear division between stars and brown dwarfs is great. It would be nice to have a similar division between brown dwarfs and planets, but I don't think nature has provided us with one. The “rule of thumb” is that anything below a mass of 13 Jupiters cannot commence any manner of fusion, and such objects are planets. But objects above 13 Jupiters have ambiguous status, showing up on lists of both brown dwarfs and exoplanets. Some "offical" exoplanet lists include bodies up to 24, or 25 Jupiters, and others even more. The discovery of the 1,000th confirmed exoplanet quickly approaches, but this milestone will be vague because of this classification issue.
You must be logged in to post a comment.
You must be logged in to post a comment.