 0
0A survey of free services and apps that let you keep tabs on space weather so you can anticipate the next great aurora.
Babak A. Tafreshi
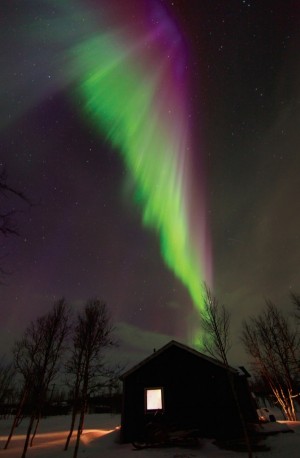
Seeing a great aurora ranks right up there with witnessing a total eclipse of the Sun. Auroraphiles travel thousands of miles and spend thousand dollars to join tours in frozen locales ringing the Arctic Circle in hopes of shivering under one of nature's grandest spectacles. The rest of us wait it out, hoping the next big aurora will find us neither asleep nor staring up at clouds.
To anticipate the next great display, you'll need a forecast and three data points: the Kp index, a measure of the degree of disturbance in Earth's magnetic field; the Bz, or direction of the solar magnetic field in the vicinity of Earth, and a visual forecast model that shows the extent of the auroral oval.
First, head over to NOAA's free product subscription service and sign in. Next, click the subscribe link, then click forecasts and summaries. Now you can subscribe to the NOAA 3-Day Forecast or any of a number of different space weather products. Twice a day, you'll receive an e-mailed forecast with estimated Kp indices every three hours for the coming three days.
The index is rated on a scale from 0 to 9 with 1 being calm and 5 or more indicating a geomagnetic storm and potential aurora sightings. When Kp = 5, auroras might be seen as far south as Maine and the northern quarter of Michigan, Wisconsin, Minnesota and North Dakota. Based on my own experience living in northern Minnesota, a Kp of 5 often means a low arc in the north with occasional faint rays extending to perhaps 20°–30° above the horizon — a minor G1 geomagnetic storm.
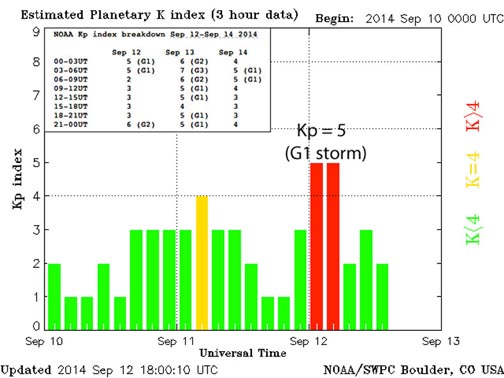
Annotations: Bob King; Source: NOAA
A Kp of 6 indicates a moderate G2 storm with auroras visible at still lower latitudes, while a Kp of 8 describes a severe G4 storm with auroras flaring as far south as Alabama and northern California. Storms are rated from G1 (minor) to G5 (extreme) and correlated with Kp indices of 5–9.
NASA
The e-mails are helpful for planning purposes, but what you really need is a live site. NOAA's got you covered at the Planetary K-Index site, where you can see a bar graph of Kp indices updated every 3 hours. Green and yellow bars indicate low activity; red means things are heating up, magnetically speaking.
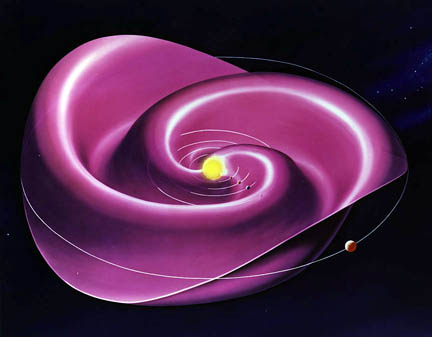
The Sun's magnetic field, carried by the steady stream of subatomic particles called the solar wind, spirals across the solar system as the interplanetary magnetic field (IMF). When it sweeps by Earth, our planet's magnetic field normally deflects the material away, and we’re no worse for the wear. But when the solar magnetic field points south — called a southward or negative Bz — it can cancel Earth’s northward-pointing field at the point of contact, opening a portal between the IMF and Earth's own field. Once linked, the IMF dumps its baggage of high-speed particles into our atmosphere to light up the sky with northern lights.
NOAA / NASA
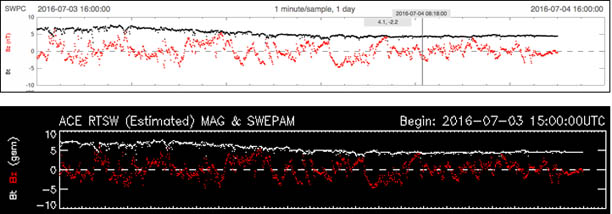
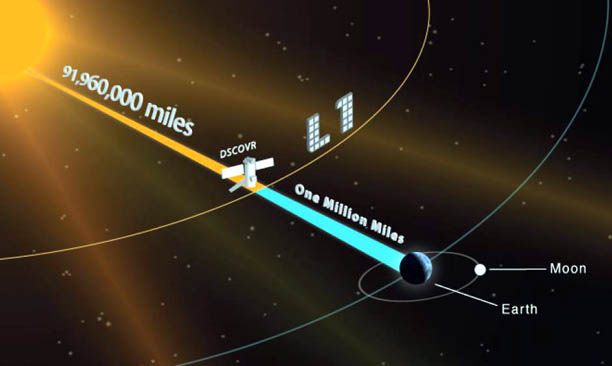
For now, you can check the Bz at two different sites. First, explore the "traditional" ACE Real-Time Solar Wind website, where data from NASA's Advanced Composition Explorer (ACE) satellite is continuously updated. The spacecraft is located at the L1 libration point between Earth and the Sun, about 932 million miles (1.5 billion km) forward of Earth, giving earthlings up to one hour advance warning of the arrival of damaging space weather events. The red trace in the topmost graph (above) is a measure of Bz. When the trace drops below the 0 line, especially if it has a negative value of –10 or greater, chances for seeing the aurora markedly improve.
When I see that the current Kp index is 5 or higher and the Bz below –5, I'm out the door to check the sky for northern lights.
NOAA / NASA
There's a second website to keep tabs on as well. Recently, NASA's Deep Space Climate Observatory (DSCOVR), also located forward of Earth at the L1 position, has begun monitoring the solar wind with a new suite of instruments to provide timely warning of space weather events. Beginning at noon EDT (16:00 UTC) on Wednesday, July 27, NOAA's Space Weather Prediction Center (SWPC) will start using data from DSCOVR to replace the data currently provided by the aging ACE satellite. DSCOVR's Real Time Solar Wind site features a couple nice options for appearance and color as well as a nifty hairline cursor that provides an accurate Bz readout as you slide it along the graph.
NOAA / NASA
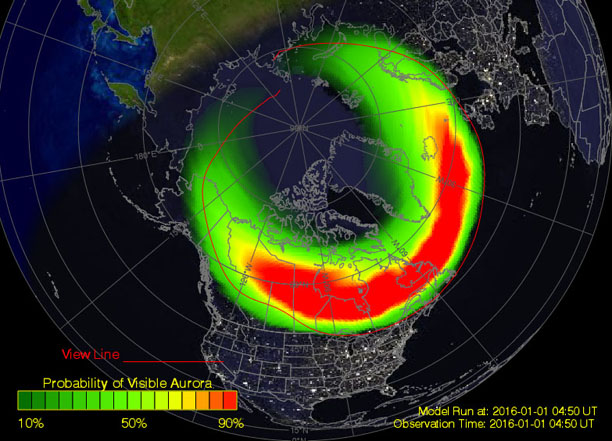
Numbers and graphs, while extremely useful, don't provide a big-picture view to put an aurora forecast in context. For that you'll need to include one more website in your arsenal, the Aurora — 30-minute Forecast. Here you'll see a model updated every half-hour showing the intensity and location of the twin auroral ovals centered on Earth's geomagnetic poles. Normally, the northern oval hugs the far north, passing over Siberia, Hudson Bay, and the northern half of Alaska. But when Earth's magnetosphere connects with the solar magnetic fields, the oval expands southward over more populated realms.
Auroral intensity is shown by color, with red a sign of increasing activity. Because most auroras are located at 60–80 miles (100–130 km) altitude, they can seen from farther afield, the same way a mountain is visible from dozens of miles away. That's why the diagram includes a "viewing line" that indicates how far south an aurora might be viewed from the ground. Another cool feature is the arrowed button under each map. Click it, wait a minute or two for the download, and you can watch a time-lapse of the oval's gyrations over the previous 24 hours.
Bob King
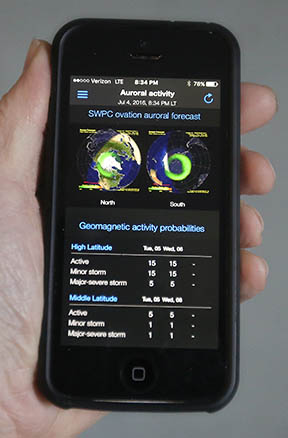
Because many of us don't carry a laptop around 24/7 but do keep a mobile device handy, you can have all the services described above delivered directly to your phone by downloading one of several free aurora prediction apps. For a couple extra bucks, some will even send you an alert should a geomagnetic storm appear likely over your location.
I use My Aurora Forecast (MAF) and Aurora Forecast (AF) for iPhone. Both show the current and forecast Kp indices, probabilities of seeing the aurora from different locations, and the latest NASA multi-wavelength photos of the Sun. MAF includes a live Bz graph, AF doesn't. AF offers alerts for $1.99 add-on and includes a snapshot of the NOAA auroral ovals, MAF does not. Since they complement each other, I keep both handy.
Both apps are also available for Android here and here. Bear in mind that like Earth weather, space weather can be unpredictable. Surprises happen from time to time including "no-shows," but with this key information at your fingertips, you should never have to wake up the next morning to hear you missed a great aurora. Unless, of course, it was cloudy!
Join the 4th annual Sky & Telescope Iceland aurora tour and see the northern lights!
About Bob King
I love the sky (day and night) and have been a skywatcher and amateur astronomer since childhood. I'm also a long-time member of the American Association of Variable Star Observers (AAVSO) and Astronomical League. I pen the Astro Bob blog and have written four books: Night Sky with the Naked Eye (2016); Wonders of the Night Sky You Must See Before You Die (2018) and Urban Legends from Space (2019) and Magnificent Aurora, published in 2024. The universe invites us on an adventure every single night. To accept the invitation, we only need look up.

Comments
You must be logged in to post a comment.