 2
2Solar Cycle 25 is here, and predictions suggest the next decade of the Sun’s activity will mimic the last one — halting a 40-year trend.
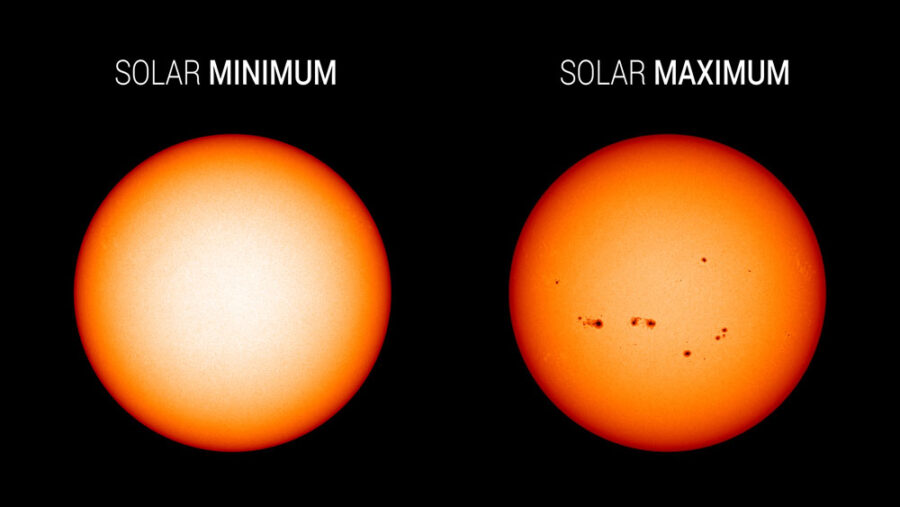
The Sun is so bright that many never really see it. Look at it through solar filters, though, and you’ll see a surprisingly small golden disk marked with sedate sunspots or pink prominences arcing along its edge.
At least, that’s what you’d see when the Sun’s active; a profound solar minimum made for 274 spotless days in 2019, when the Sun’s disk appeared blank.
Now, we can again look forward to increasing numbers of sunspots — not to mention flares, explosions known as coronal mass ejections (CMEs), and corresponding space weather at Earth. Scientists at NASA and the National Oceanic and Atmospheric Administration (NOAA) have declared December 2019 as solar minimum, marking the beginning of Cycle 25. What’s more, they’ve predicted what the next decade of solar activity has in store.
NASA
Cycles of Sunspots
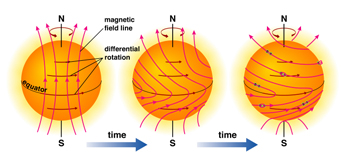
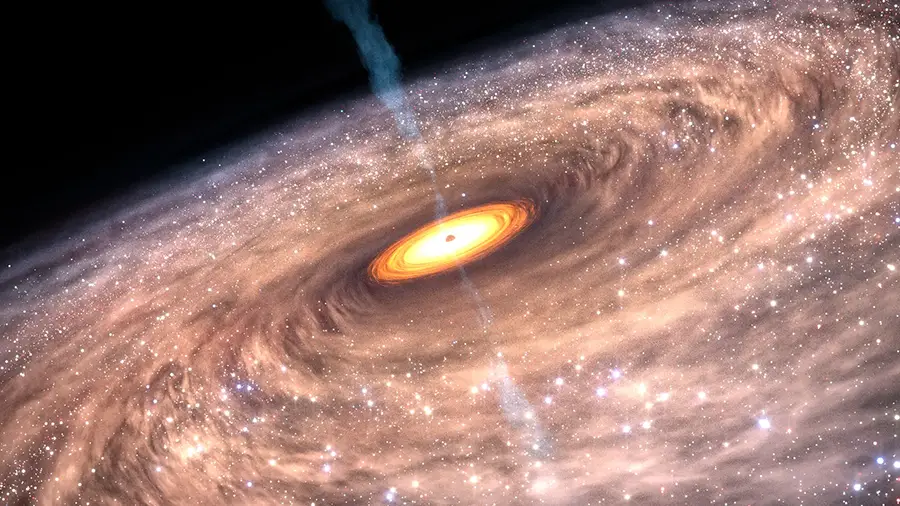
The Sun is a ball of churning gases, whose constant motions are best viewed by space telescopes in ultraviolet light. But centuries before the Space Age, astronomers were already recording sunspots, regions where the Sun’s magnetic field pokes through its visible surface, trapping gas so that it appears dark against the bright disk. Sunspots are often sources of other magnetic activity such as flares and CMEs.
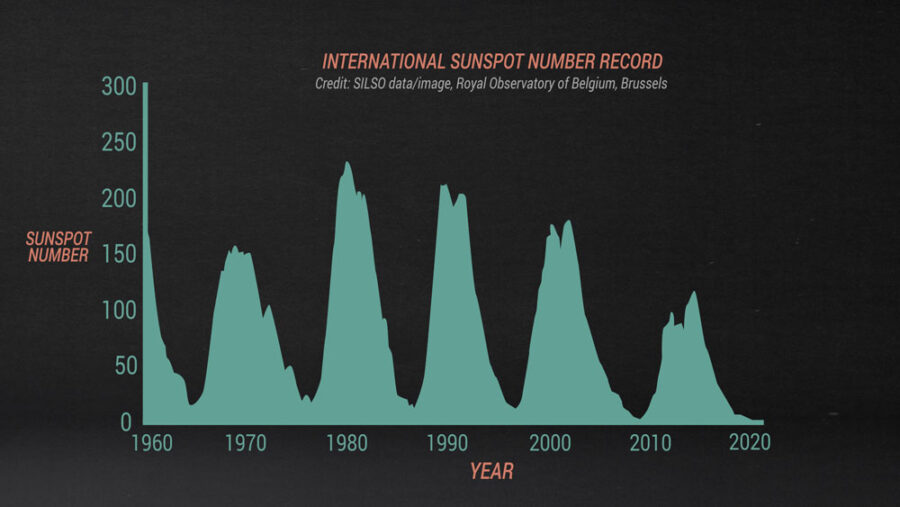
The sunspot record shows an 11-year cycle, as the number of sunspots increases and then decreases again over that timeframe. (In fact, since the Sun’s magnetic poles actually switch every 11 years, the full cycle is really 22 years long.)
A multitude of spacecraft — most recently, NASA’s Parker Solar Probe and the European Space Agency’s Solar Orbiter — are giving us an increasingly detailed understanding of the Sun. But because the historical record is tied to sunspots, that’s the indicator organizations such as NASA and NOAA still use to understand longterm activity. The World Data Center for the Sunspot Index and Long-term Solar Observations currently tracks the daily sunspot number in a standardized way.
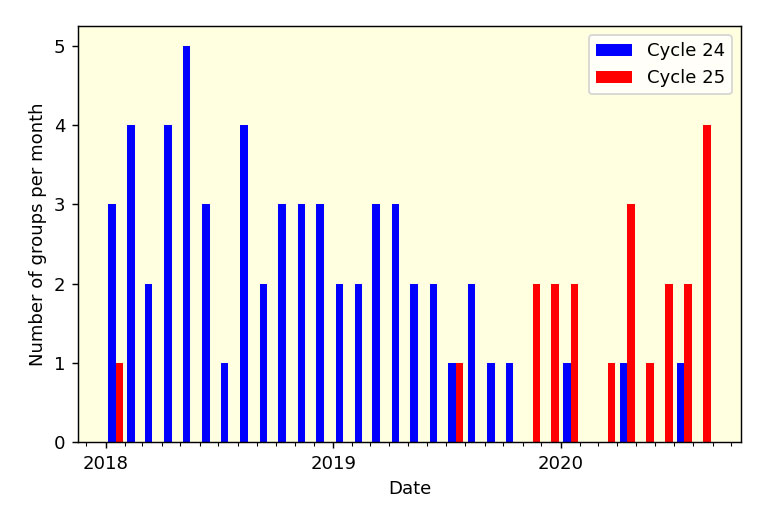
“We keep a detailed record of the few tiny sunspots that mark the onset and rise of the new cycle,” says center director Frédéric Clette. “These are the diminutive heralds of future giant solar fireworks. It is only by tracking the general trend over many months that we can determine the tipping point between two cycles.”
SILSO / Royal Observatory of Belgium
This data formed the basis for the Solar Cycle 25 Prediction Panel, an international group of experts who determined the timing of the solar minimum and forecasted the next cycle of activity. Averaging the sunspot number over 13 months to smooth out the Sun’s variability, the panel determined that solar minimum had arrived in December 2019 with an average sunspot number of 1.8.
Cycle 25 Forecast
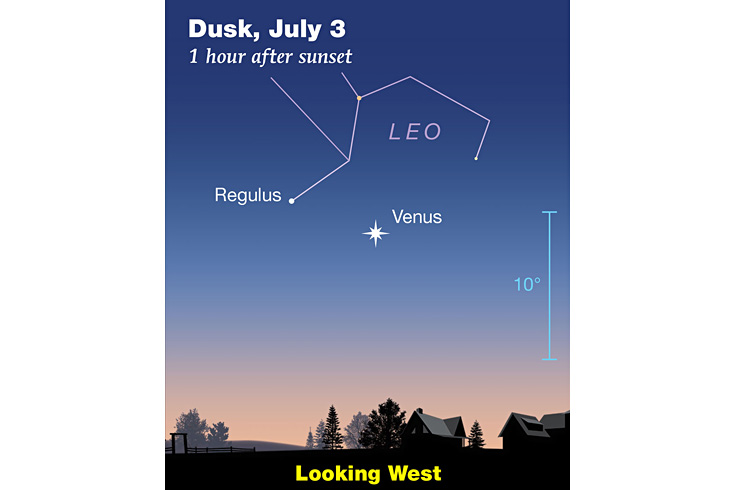
The panel also came to a consensus on forecasts suggesting the next peak in activity will come in July 2025, with 115 sunspots. That prediction, while weaker than average, is almost exactly the same as what actually occurred in Cycle 24: Sunspot numbers peaked in April 2014 with an average of 114 sunspots.
The prediction affects long-term planning in industries from satellites to aviation to the power grid. Extreme solar storms can overwhelm transformers and shut down satellites, but even more prosaic space weather can cause damage that builds up over time. On the flip side, a lack of solar activity means easier penetration by galactic cosmic rays — a concern for airplanes flying at high latitudes on Earth.
Data: SILSO; image: Royal Observatory of Belgium, Brussels
The forecast suggests that Cycle 25 will interrupt the trend of decreasing activity that had been going on for more than 40 years. Cycle 24 was the weakest cycle in 100 years, and the fourth weakest since regular sunspot numbering began in 1755. Some had even speculated that the Sun could be approaching a largely sunspot-less period, echoing the Maunder Minimum that occurred earlier on, from 1645 to 1715. But although Cycle 25 will likely still be weak, forecasts contradict the notion that we are headed for a more profound change in solar magnetic activity.
One reason for Cycle 24’s anomalously weak cycle is that the Sun’s magnetic behavior was strangely asymmetrical. Because the Sun’s northern hemisphere peaked in sunspot activity two years before the southern hemisphere, the April 2014 maximum had less spots than it would have otherwise.
Reaching Consensus
“The Cycle 24 prediction came from a panel split on the prediction,” says David Hathaway (Stanford University), a solar physicist who was on the panel at the time. Initially, that panel had to settle for two predictions: a peak of 140 sunspots in October 2011 or a much weaker peak of 90 sunspots in August 2012. In the end, the cycle ended up peaking much later than expected and with a middling but still weaker than average number of sunspots.
© Addison Wesley
Cycle 25 is a different story. “Panel consensus was quick and solid,” says Doug Biesecker (NOAA), chair of both panels.
The biggest difference between the two panels, and the simulations and forecasts they each considered, was a key realization: “Previously, we’ve treated the Sun as one big ball of gas,” Biesecker explains. “But the hemispheres of the Sun behave independently.”
Monitoring the Sun’s polar regions — specifically, the strength of the magnetic field there — turns out to be a key indicator of how the next cycle will transpire. Put that information into physics-based models that describe how magnetic fields are transported through the Sun, and from low latitudes near the equator up to high latitudes near the poles.
“Consensus was easier because there was such good agreement with the physics-based methods,” agrees co-chair Lisa Upton (Space Systems Research Corporation). “The models we have the most confidence in have evolved significantly in the last decade.”
About Monica Young
Monica Young, a professional astronomer by training, is News Editor of Sky & Telescope.


Comments
[email protected]
September 27, 2020 at 7:26 am
OK but how many times was the prediction for cycle 24 revised downward? They are guessing. Why no mention of the Sun's effect on our climate? The double boiler analogy fits the facts. Solar activity started declining in 1990 but things continued warming just as the water in the center pot continues to warm after the heat is turned off.
Look at the amount of sea ice in the arctic. There is more ice there now than 8 years ago. Sea ice in the Antarctic is at near record levels. Check the NOAA sea ice page.
You must be logged in to post a comment.
Monica YoungPost Author
January 22, 2021 at 9:40 pm
The prediction panel for Cycle 24 reconvened once to settle on a lower number of predicted sunspots. Regardless, though, sunspots have a negligible effect on Earth's climate. You can read more about that topic here: https://climate.nasa.gov/blog/2910/what-is-the-suns-role-in-climate-change/
You must be logged in to post a comment.
You must be logged in to post a comment.