 0
0
If you've heard of machine learning, you may have heard it in the context of self-driving cars, thinking refrigerators, iPhone's Siri, or myriad other new and emerging technologies. But this specialized application of artificial intelligence is becoming more prevalent in astronomy, too, as astronomers grapple with Big Data sets of the celestial sphere. See for example how neural networks helped discover hypervelocity stars in Gaia data and spot eclipsing binaries in the OGLE survey.
The December 2017 issue of Sky & Telescope delves into this new tool that's taking the astronomy world (as the rest of the world by storm). But I confess that even as I decided to write this article, I still thought of machine learning as a topic too complex for me to fully understand. It was only as I began researching in earnest that I realized that the basic principles are surprisingly straightforward — not least because there are so many resources out there that can help you to learn how machines learn.
Free Online Tutorial

A free tutorial written by Jake VanderPlas, the Python Data Science Handbook, takes you step by step through the Python code that's often used to run machine-learning algorithms, and then through the different types of machine learning. For a great overview of what machine learning is (and what it's not), take a look at the introduction to Chapter 5, What Is Machine Learning?
You can go through the whole tutorial if you want to learn to code in Python and plot results. Or dive straight into Chapter 5 for specific examples that show you the inner workings of different types of machine learning algorithms.
Visualize Machine Learning: No Coding Required
Precisely because machine-learning algorithms at first appear so complex, numerous online visualizations exist to help you wrap your mind around how one type of algorithm or another works — without ever having to write a line of code.
Naftali Harris
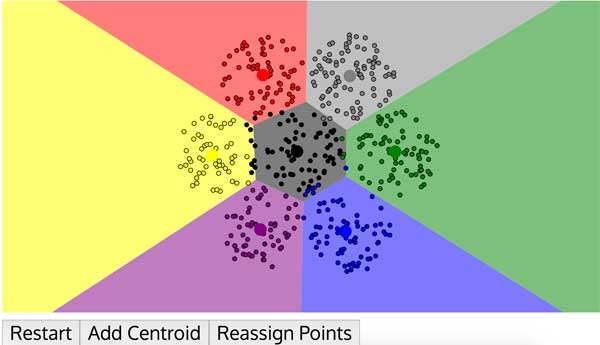
One example is Naftali Harris's blog, which visualizes a few different machine learning algorithms. Take k-means clustering. It's a foreign-sounding name, but the upshot is that the algorithm clusters data — by itself. Give it a scatter plot and tell it that there are two groups within that data, and it will determine how best to separate the data points to make two groups. The algorithm has its downsides (for one, it can't tell how many groups there are on its own), but it's still used quite a bit in astronomy and elsewhere. Visualize how this works with Harris's interactive tool.
Experiment and you'll soon see that the algorithm "learns" how to group data points using two simple, repeating steps. Is the algorithm actually intelligent? No, of course not. But play with the interactive tool and you'll soon see that this surprisingly straightforward mathematical iteration manages to replicate the kind of pattern recognition that humans can do by eye.
Similar visualizations exist for other types of algorithms, such as neural networks.
Go Deeper
For those interested in a more in-depth introduction to machine learning, Andrew Ng's Coursera course comes highly recommended.

Comments
You must be logged in to post a comment.