 4
4This week astronomers have announced the completion of the largest 3D map of galaxies across the cosmos, plus exquisite radio observations show what happens when a stellar intruder interrupts planet formation.
Largest 3D Map of the Cosmos

D. Schlegel / Berkeley Lab using data from DESI
Only seven months into a five-year survey, the Dark Energy Spectroscopic Instrument (DESI) has already surpassed all other cosmic surveys to date, creating the largest and most detailed map of the universe.
The instrument is installed on the Nicholas U. Mayall 4-meter telescope at Kitt Peak National Observatory near Tucson, Arizona. Its operations are aided by 5,000 robots that position optical fibers, through which the detector measures an object's spectrum.
Though DESI saw first light in late 2019, pandemic-related factors meant that the official sky survey didn't begin until May 2021. DESI scientists presented some preliminary results at this week's CosmoPalooza.
DESI is basically the Sloan Digital Sky Survey on steroids. Like the long-running and transformative SDSS, DESI is also a full-sky survey but with the ability to measure more precise spectra, and therefore more precise distances to far-away objects. DESI monitors the Northern Hemisphere sky, due to its location, and will amass spectra of 35 million galaxies and quasars within five years. (It has already collected 7.5 million to date.)
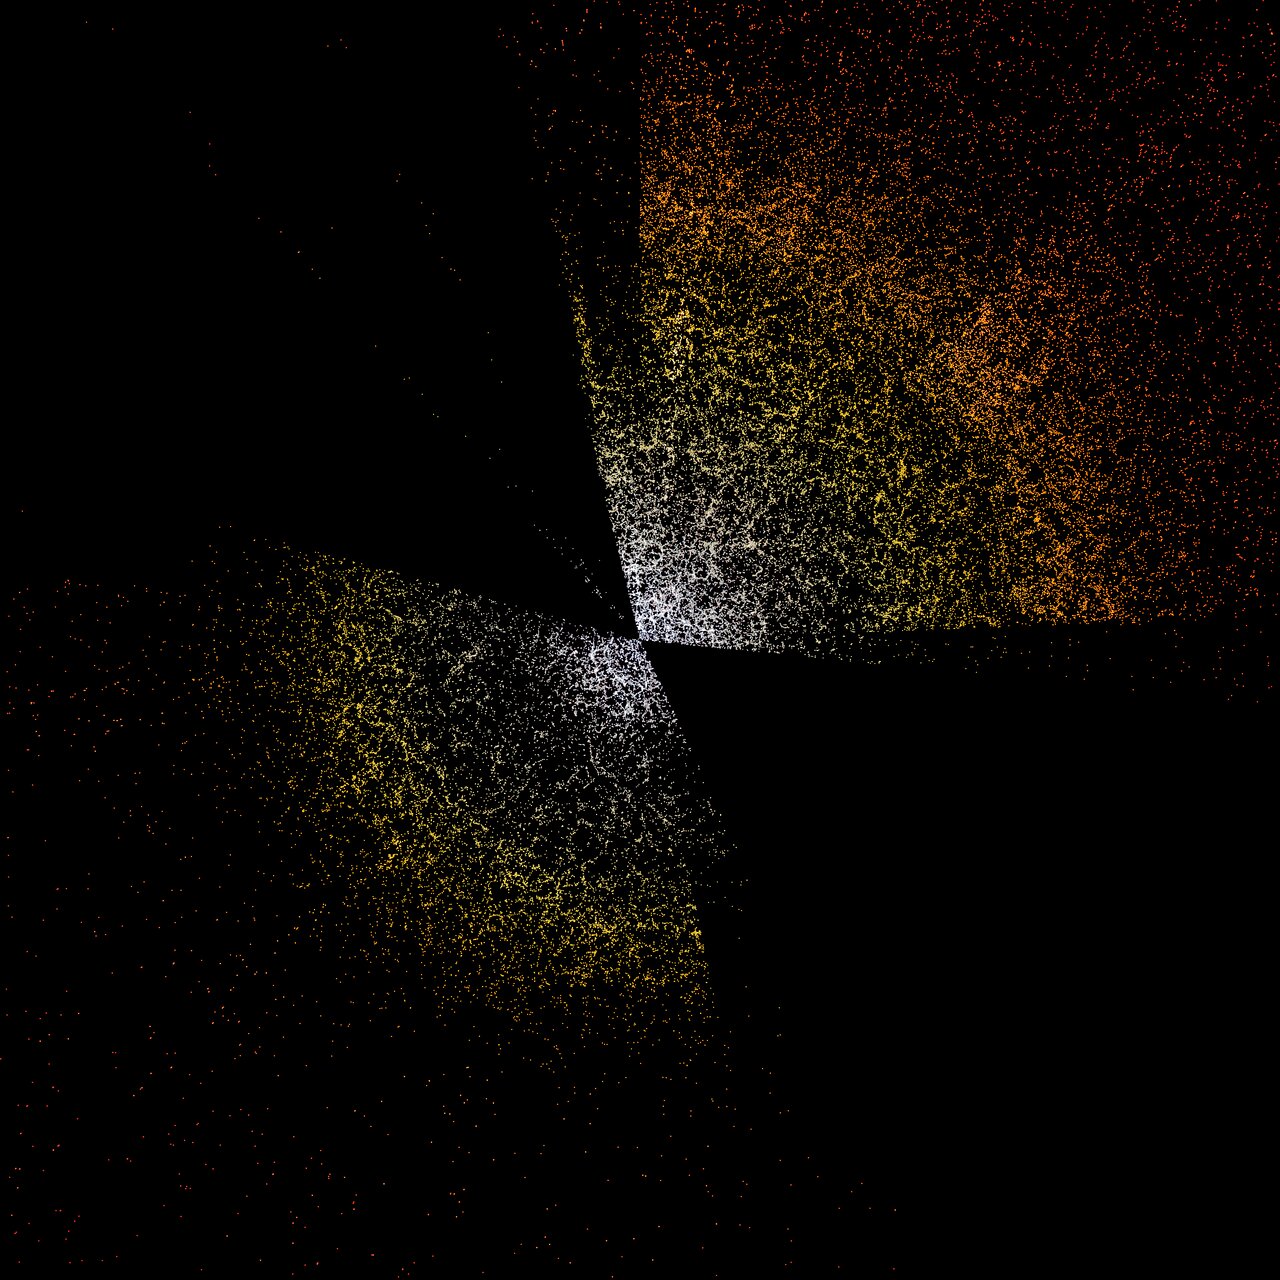
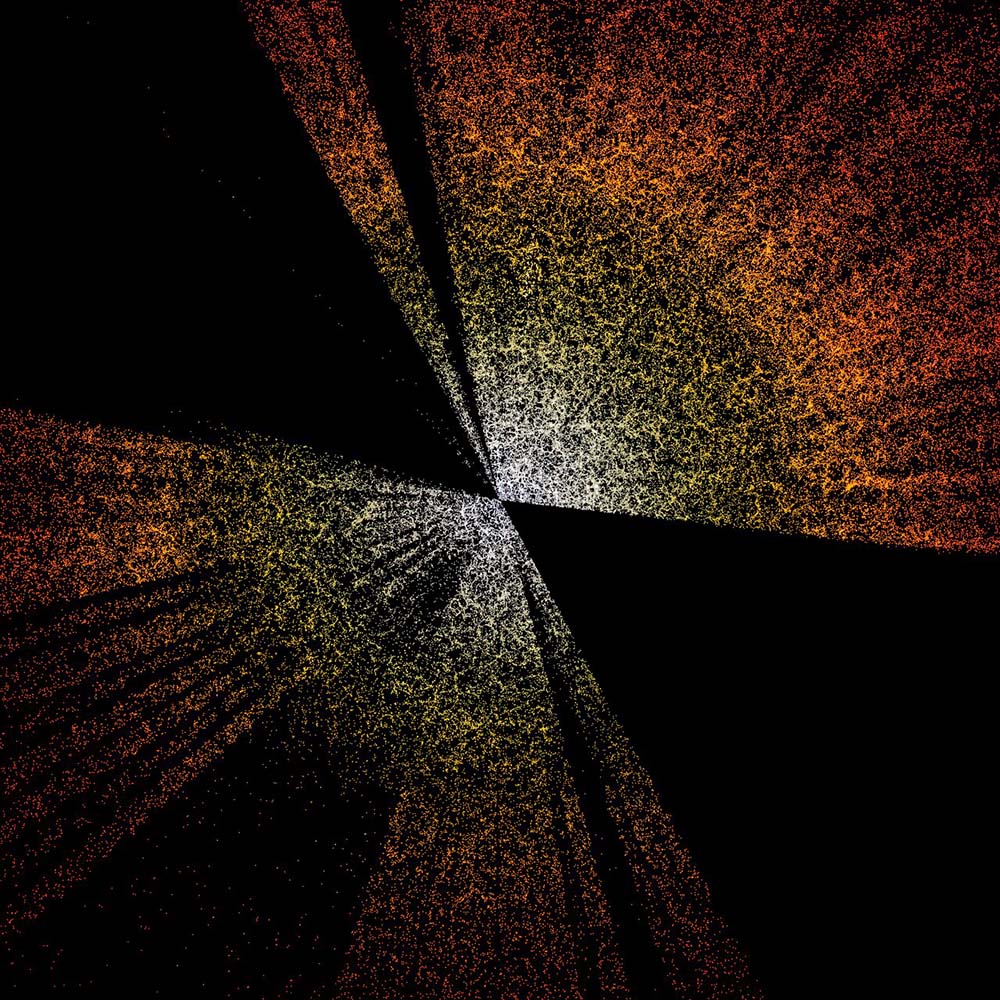
The primary goal of DESI is nothing less than reconstructing the last 12 billion years of the universe's expansion, ultimately shedding light on the mysterious dark energy that makes up 68% of the universe's content.
“There is a lot of beauty to it,” says Julien Guy (Berkeley Lab). “In the distribution of the galaxies in the 3D map, there are huge clusters, filaments, and voids. They’re the biggest structures in the universe. But within them, you find an imprint of the very early universe, and the history of its expansion since then.”
Learn more about the survey and all the science it will return in DESI's press release.
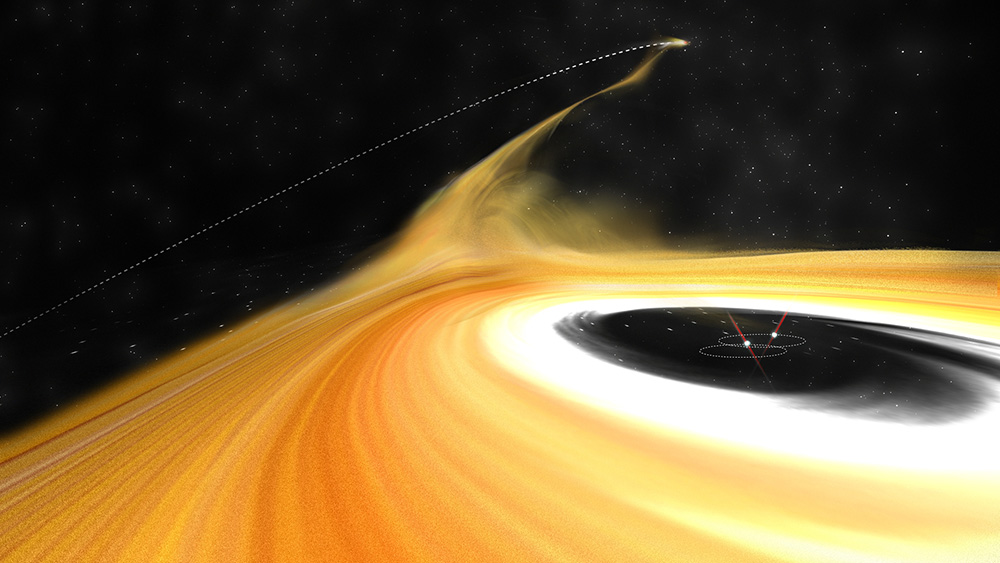
Stellar Intruder Disrupts Protoplanetary Disk
ALMA (ESO / NAOJ / NRAO) / B. Saxton (NRAO / AUI / NSF)
Astronomers using the Atacama Large Millimeter/submillimeter Array in Chile and the Karl G. Jansky Very Large Array in New Mexico, both radio observatories, have captured swirls of dust that signal an epic hit-and-run.
The star Z Canis Majoris is a pair of stars about a million years old, and their surrounding disk of dust and gas is presumably still busily building planets. Just 4,700 astronomical units (a.u.) away is a bright point of light that, based on its emissions, is probably a protostar. And between that star and Z Canis Majoris is a 2,000-a.u. streamer of dust and gas that the protostar's gravity swept out from the disk.
For some perspective, the farthest-traveling spacecraft, Voyager 1, is 155 a.u. from the Sun; the Oort Cloud, a distant repository of long-period comets, extends from about 2,000 to 10,000 a.u.
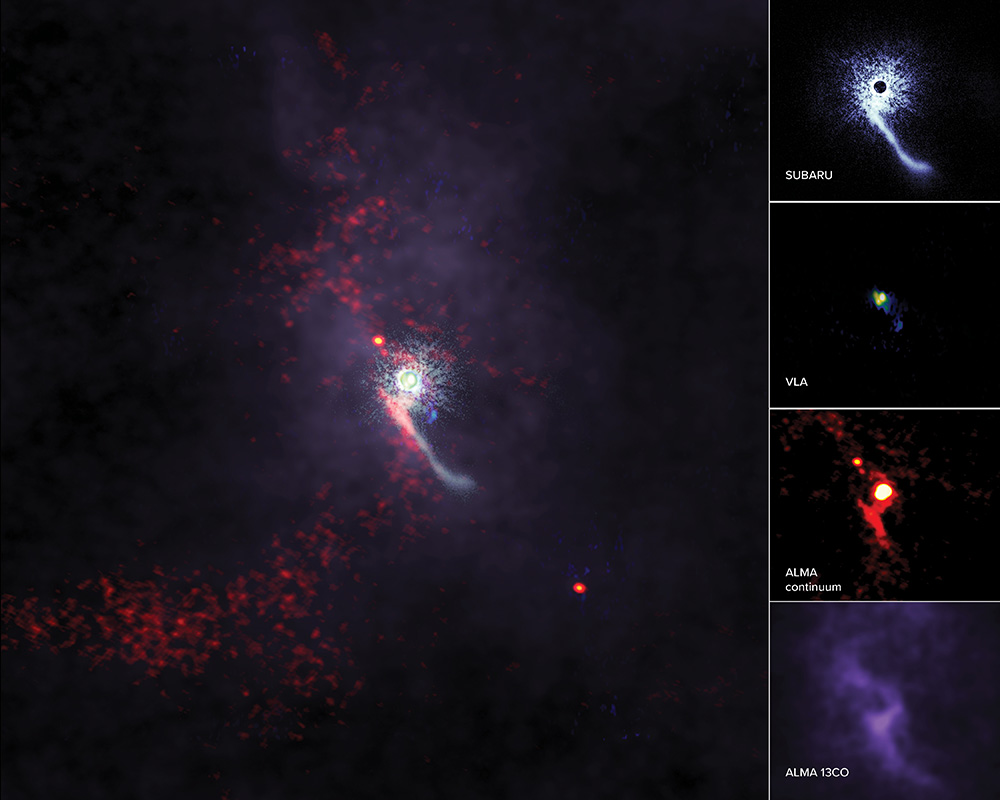
ALMA (ESO / NAOJ / NRAO) / S. Dagnello (NRAO / AUI / NSF) / NAOJ
Due to the streamer's size, astronomers had already noticed it two decades ago. Some proposed that it was related to an outflow from the stellar pair, which can get a bit bursty from time to time. But the new observations reveal for the first time the point of light at the end of the streamer, and they suggest that something else is afoot: a stellar flyby.
Simulations recreating the event explain the streamer with a distant pass — the protostar never actually touched the disk. Z Canis Majoris's protoplanetary disk extends about 840 a.u., but the closest the protostar came to the system was about 3,000 a.u. Nevertheless, its gravity would have tugged on the disk's dust and gas, unfurling it into space. While this isn't the only scenario that can explain the observations, it's the one the researchers found the most compelling.
This research was published January 13th in Nature Astronomy, and the National Radio Astronomy Observatory has a press release with more details.
About Monica Young
Monica Young, a professional astronomer by training, is News Editor of Sky & Telescope.

Comments
floatplane
January 14, 2022 at 3:08 pm
Fascinating results from DESI. Although I can make out some of the tendrils of the universe's structure from that animation, it's hard to see the full picture. Are they going to transform the dataset into a 3D image instead of the "CT scan" style slices? That way we could "fly" through the model to get an idea of the structures shapes and extent. Seems like we need another DESI in the southern hemisphere to complete the survey.
You must be logged in to post a comment.
Andy.eu
January 25, 2022 at 5:36 am
What would also be useful and helpful would be an interactive 3D map where you can zoom in and fly through.
Do you think that would be possible?
You must be logged in to post a comment.
Monica YoungPost Author
February 2, 2022 at 2:26 pm
I've added a slightly different 2D representation that compares a subset of DESI's preliminary map to the Sloan Digital Sky Survey and perhaps helps visualize the cosmic web a bit better. Ultimately, I am sure they will be able to use this data to do "fly-through" animations, as they've done the same for SDSS, but such data visualizations are difficult to put together and take time. They may decide to wait for more data before going through the paces.
You must be logged in to post a comment.
retroformat
January 17, 2022 at 9:37 pm
A stereoscopic representation would be useful. It's difficult... actually just about impossible, to get a real sense for the 3d structure from the animated data. Can we ask the authors for a stereoscopic image of the entire dataset?
You must be logged in to post a comment.
You must be logged in to post a comment.