 3
3The Planck team has finally released its full-mission data, revealing a remarkably detailed view of our universe and our galaxy.
The moment I’ve been waiting months for is finally here: the full-mission data from ESA’s Planck satellite are public. Scientists presented the results at a Planck conference in Ferrara, Italy, in December, but the official analysis papers are only now coming out. Most were posted on the Planck Publications website on February 5th, with a few stragglers still in the wings.
Credit: Planck Collaboration
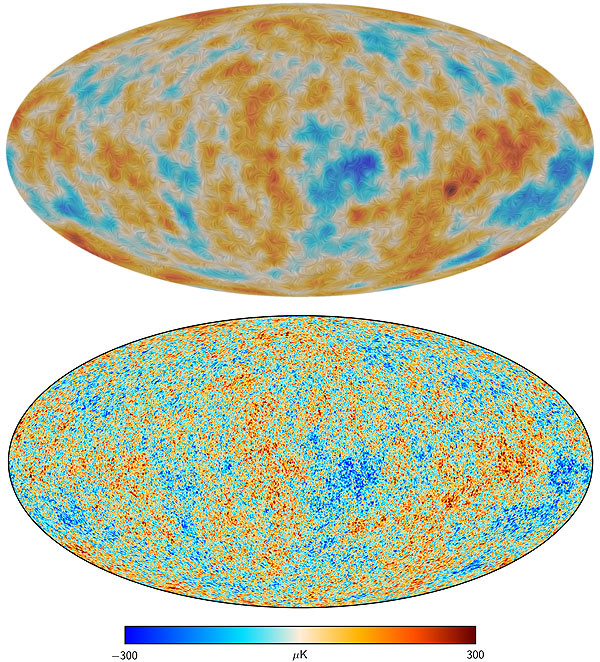
Planck launched in 2009 to study the cosmic microwave background (CMB), the relic radiation from the universe’s birth. Density fluctuations in the universe’s earliest moment spawned the splotchy pattern we see in the CMB and, in turn, served as seeds for the growth of cosmic structure. Understanding why the CMB looks the way it does therefore helps us understand the entire universe (more on that later).
Observing in nine frequencies spanning 30 to 857 GHz, Planck mapped the CMB’s temperature and (in seven frequencies) polarization, with angular resolutions between 33 and 5 arcminutes, depending on the frequency. It shut down on schedule four years later in 2013.
The team released the temperature observations from the mission’s first 15 months in 2013. These data were mostly in beautiful agreement with the predictions of the standard cosmological model. Since then, the team has been working fiendishly to analyze the full, four-year data set.
How Astronomers Find the Universe in the CMB
Credit: Planck Collaboration
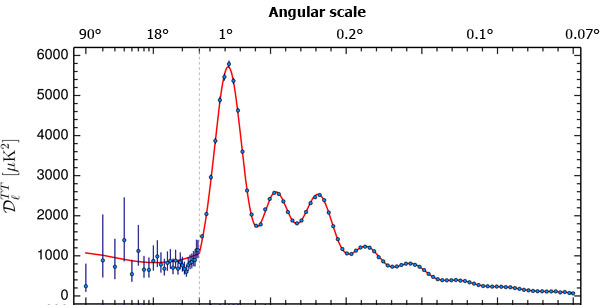
This endeavor is a challenging one, explains Planck team member Charles Lawrence (JPL). Cosmologists start with the splotchy CMB pattern. From that they calculate what’s called the power spectrum, which reveals the strength of the CMB’s fluctuations at different angular scales. (The power spectrum is the wiggly graph at right.) The power spectrum is the cornerstone of the whole effort: it’s this statistical map that cosmologists base their CMB analysis on.
The cosmologists then make some assumptions about what kind of universe they’re dealing with — in astrospeak, they assume the standard lambda-CDM model, which includes (1) a particular solution to the general relativistic equations of gravity, (2) a universe that looks basically the same on large scales and is expanding, (3) an early period of stupendous expansion called inflation, and (4) quantum fluctuations that seeded today’s large-scale matter distribution.
From there, they start tweaking the assumptions, like a dressmaker tucking and letting out a dress pattern until it fits right. They could even chuck any assumption that proves to be bad. Eventually, they find the pattern that most successfully fits the CMB.
The amazing thing is, this method works. It works really well. That’s because back when the universe cooled down enough to become transparent to the CMB’s radiation (about 380,000 after the Big Bang), the universe was simple. By simple, I mean the universe was basically a hot, bland soup of particles and dark matter and there weren’t any chemical reactions going on. So scientists can actually figure out, to very high precision, the exact setup that would create the CMB we observe.
The Punchline: Planck’s Cosmology Results
Credit: Planck Collaboration
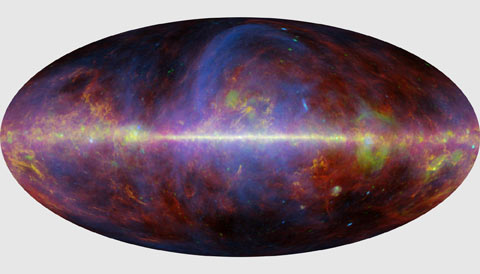
For those of us who have been impatiently squirming for the Planck team to finish this herculean task, the new data deluge justifies the wait. These data are gorgeous. Like, disgustingly gorgeous. Even the foreground maps, which include things that sullied Planck’s view of the CMB (such as our galaxy’s dusty disk), are exquisite.
The 2015 release upholds that of 2013, with only slight tweaks to various cosmological parameters. It still overwhelmingly favors an early universe defined entirely by six parameters, no matter how many ways the team pushed and prodded the data. These parameters are
- The density of baryonic matter (a.k.a. normal, like you and me) in the first few minutes of the universe
- The density of cold dark matter at that same time
- How far sound waves had traveled when the CMB photons were released — also known as the “sound horizon” or the size of baryon acoustic oscillations
- The fraction of CMB photons over the universe’s history that have scattered off particles set free by radiation from stars/quasars ionizing the neutral hydrogen filling the cosmos
- The strength of the initial density fluctuations on a physical scale of about 65 million light-years (20 megaparsecs) at the end of inflation*
- How the strength of the density fluctuations on various scales at the end of inflation changes with scale
From these, the team can calculate just about anything you please, such as the universe’s age and its expansion rate. The exact values depend on which data subsets you want to include, but here are some notable ones from the team’s overview paper:
- Age of universe: 13.799 +/- 0.038 billion years (note: that means we know the age of the universe to within 38 million years. Just think about that for a second)
- Hubble parameter: 67.8 +/- 0.9 km/s/megaparsec (this is the universe’s rate of expansion, more on this in a minute)
- Fraction of universe’s content that is “dark energy”: 69.2 +/- 1.2%
The So What
The latest Planck data say some interesting things about the universe. For one, the universe’s expansion rate, called the Hubble parameter, is still lower than what astronomers previously calculated using supernovae (about 73 km/s/Mpc). That was a surprise in the 2013 release, and it’s still odd. Several other measurements have also been pushing the Hubble constant down, so it looks like a lower expansion rate is here to stay. Maybe there’s some new physical ingredient at work, but we don’t know yet.
In the discussion of what dark matter is, one idea is that it’s its own antiparticle and so if two of its particles collide, they’ll go poof. There’s no sign of dark matter annihilation in the physics needed to explain the CMB observations, although Planck does leave the door open for the level of annihilation suggested as an explanation for diffuse gamma-ray emission from the Milky Way’s center. And it looks like there are definitely only 3 flavors of neutrino (in case you were still holding out hope).
There’s still the strange problem of the missing galaxy clusters. The Planck team finds a certain lumpiness in the CMB, which should match up with the lumps in the distribution of matter in the universe (a.k.a. cosmic structure, which is made up of galaxy clusters). But Planck predicts about 2.5 times more clusters than are actually observed. This could be due to error in the estimates from either side, or due to new physics.
One neat result is that the era of reionization — basically, when the universe’s galaxies really started lighting up with stars — is later than estimated using data from Planck’s predecessor, WMAP. WMAP had favored reionization at a redshift of 10 (470 million years after the Big Bang), but Planck pegs it at 8.8 (560 million years after the Big Bang).
“For many cosmologists, I would say that it is a relief,” says David Spergel (Princeton), who worked on the WMAP team. Scientists studying early star formation had a hard time explaining the earlier start time from WMAP, so a slightly later start is a good thing.
Then there are the implications for inflation. No. 6 in the list of parameters (how the strength of the density fluctuations changes with angular scale), is called ns, or the scalar spectral index. It’s important because it describes the state of affairs at the end of inflation, and the fluctuations it measures are the ones that started sound waves sloshing in the universe’s primordial plasma and ultimately led to the CMB we see. Planck finds a value of 0.968, which means that the strength of the fluctuations is slightly larger on larger scales — predicted by most inflation models. This offset has a slight effect on galaxies’ formation rate over time.
The Planck team also did its own analysis of how big any gravitational waves triggered by inflation would be in their data, an analysis separate from the joint analysis done with the BICEP2/Keck Array folks. Adding together the Planck-only result and the Planck-BICEP2 result, the team found an upper limit on the ratio of gravitational waves’ strength to the density fluctuations’ strength of 0.08, slightly lower than the one from the joint analysis (0.12) and the Planck 2013 analysis (0.11). (The new Planck-only upper limit is 0.10.)
These results home in on some of the simpler types of inflation. (Take a look at the number of inflation models out there.) These involve an inflation spawned by the decay of a single energy field, a field that decreased slowly compared to the universe’s expansion rate. (Given that the observable universe expanded at least 5 billion trillion times in 10 nano-nano-nano-nanoseconds, that’s not that slow.) The energy scale implied for inflation is less than 2 x 10¹⁶ gigaelectron volts, on par with the level expected for the merger of the strong, weak, and electromagnetic forces into one (called the Grand Unified Theory). Physicists think these forces were united in the first mini-moment of the universe, then broke apart. Their breakup might somehow be connected to inflation.
And if that wasn't long enough for you, check out the Planck team's 2015 publications. Plus, the Kavli Foundation did a Q&A with Planck team member George Efstathiou about the implications of these latest results.
*Updated: In the original version of this blog, the descriptions of cosmological parameter #5 and #6 described the same parameter. Parameter #5 is now updated to be the amplitude of the initial density fluctuations, and the scalar spectral index is now #6, to match the order given in the Planck literature. Fun fact: Planck's value of parameter #5 says that, after inflation, the density of matter varied only 0.000000002 on a scale of 20 megaparsecs.
About Camille M. Carlisle
Science Editor Camille M. Carlisle handles science features for Sky & Telescope. She specializes in black holes, Mars, and whatever she happens to be writing about at the time. Frolic with her through the delights of black holes in her blog, The Black Hole Files.


Comments
Anthony Barreiro
February 10, 2015 at 2:54 pm
Thanks for this clear and enthusiastic report. I continue to find Sky and Telescope the best source of news about cosmology -- not too dumbed-down, not too technical, just right for this interested layperson.
ESA has been doing some very successful science missions in recent years, including Planck and Rosetta. I'm looking forward to the astrometry and photometry results from Gaia. Come to think of it, ESA is "covering the waterfront" from planetary science to mapping our galaxy to understanding the whole darn universe. They seem to develop remarkably efficient spacecraft with very clearly defined science goals. Sometimes smaller is better.
You must be logged in to post a comment.
Lindsay
February 13, 2015 at 6:57 pm
This was an excellent report. Thanks Camille.
This probably shows my ignorance about the standard model and these measurement, but what do these data say (if anything) about the accelerated expanse rate of the outer region of the Universe? Is that predicted by the "standard lambda-CDM model?"
You must be logged in to post a comment.
Camille M. CarlislePost Author
February 23, 2015 at 3:47 pm
Do you mean the fact that the more distant the galaxy, the faster it's receding from us? That's a byproduct of how cosmic expansion works. The WMAP folks put together a short explanation (and I recommend poking around the WMAP site for more info on cosmology); basically, you can think of the universe like a loaf of raisin bread baking in the oven. Say a "unit" of dough always doubles in size in 10 minutes. Then in 10 minutes, two raisins that began 2 units apart will be 4 units apart, but two raisins that were 4 units apart will now be 8 units apart. So the expansion rate of the dough is the same throughout the loaf, but that translates into the raisins moving apart from one another at a speed that's proportional to their distance from one another. That's what we mean in the units of the Hubble constant, which are kilometers per second per megaparsec (km/s/Mpc): a galaxy is moving away from us at a speed that's proportional to its distance. (Did that help?)
You must be logged in to post a comment.
You must be logged in to post a comment.