 5
5Margaret Greenwood explores the changing location of sunrises throughout the year.
The sunrise on the east bank of the Columbia River in Richland, Washington, is visible throughout the entire year from my home on the opposite bank. So, after retiring from a career of teaching and physics research, I decided to document the sunrises by taking photographs from the sunroom of my home and also investigate theoretical calculations to extend my knowledge.

All images credited to Margaret Greenwood
I used a fairly inexpensive camera (20.2 Megapixels) mounted on a tripod and shot the photographs through the double-paned glass of the sunroom window. For safety my eyes were focused on the screen of the camera, but occasionally I did glimpse the sun for a fraction of a second.
The photographs, obtained on 95 days between March 27, 2018, and April 2, 2019, provide a close-up view of each sunrise amid nearby houses and landscape.
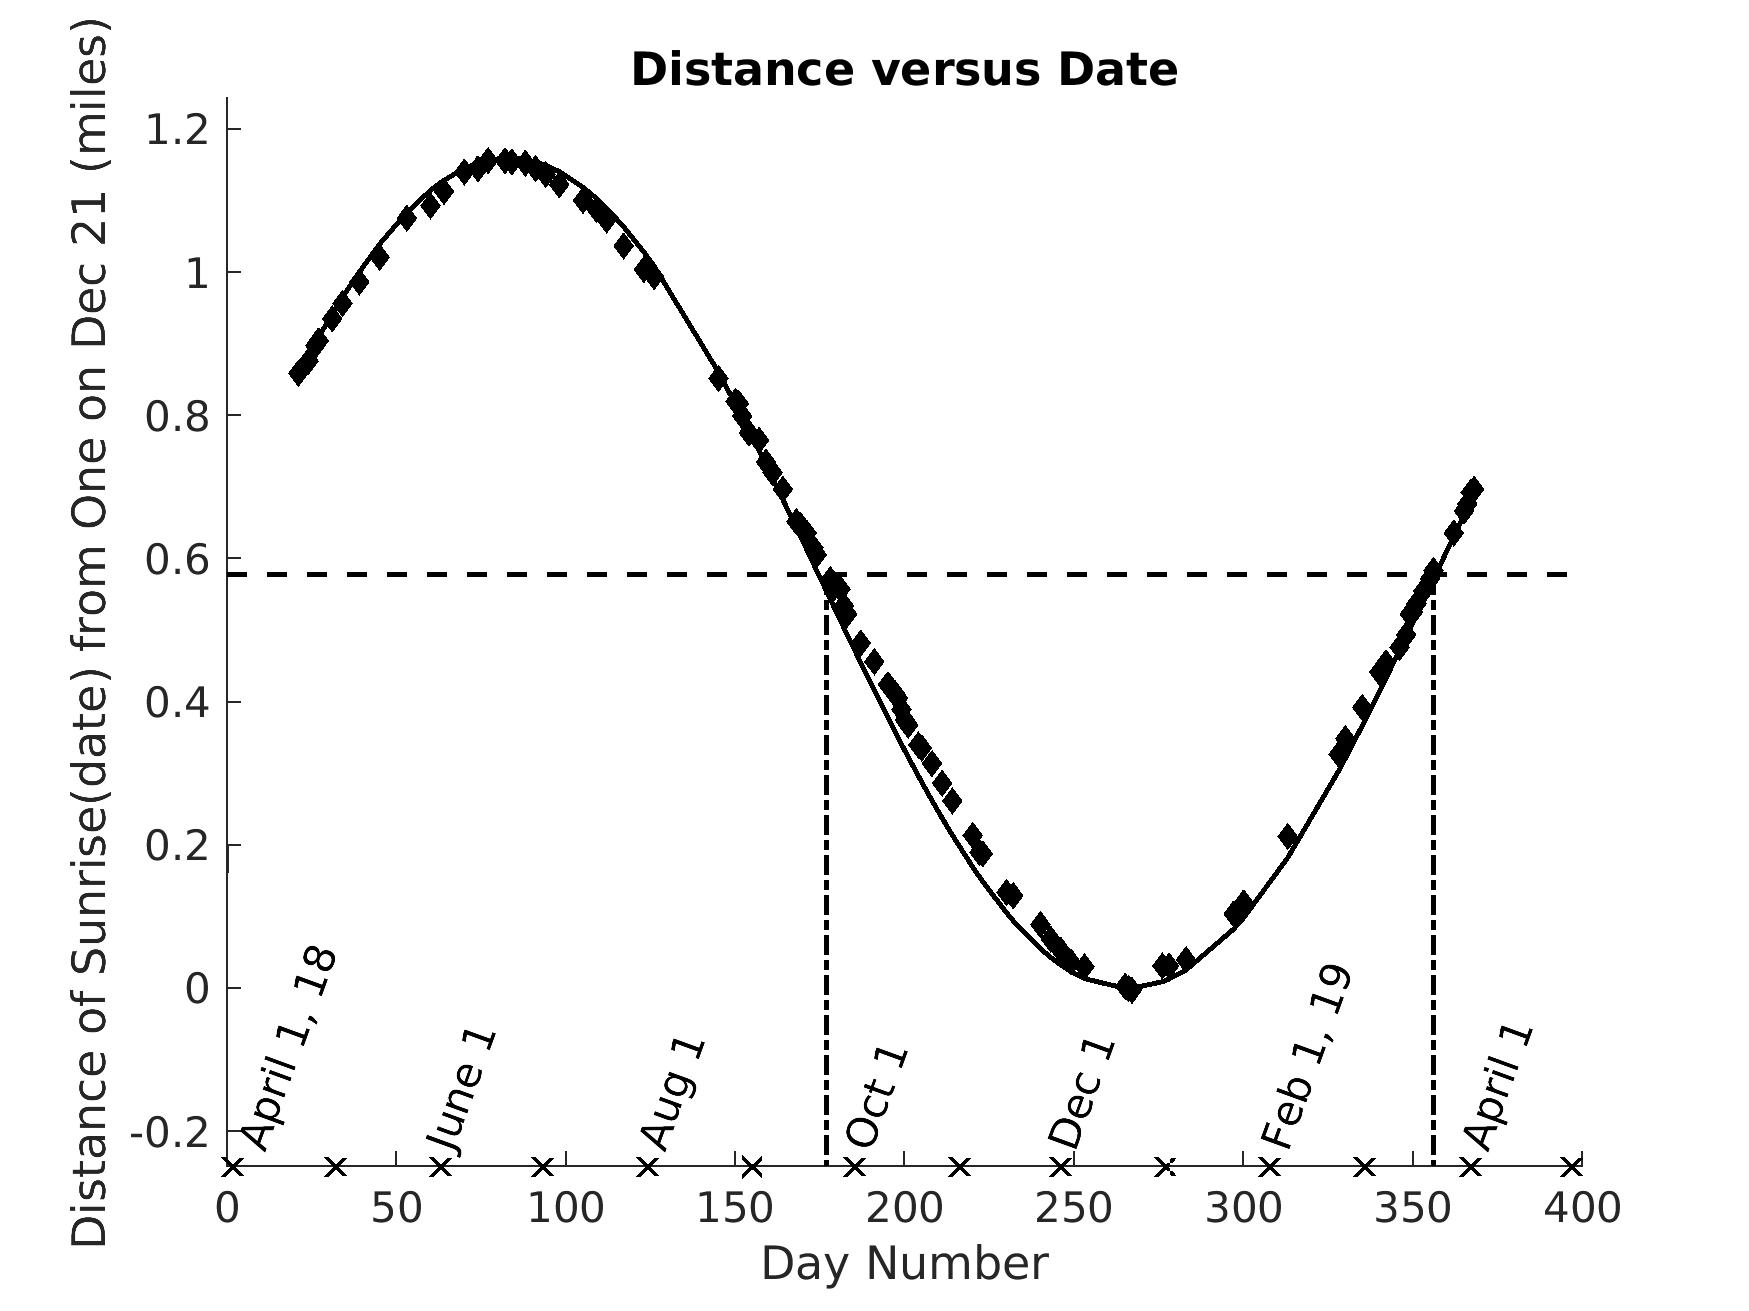
Distance measurements obtained from Google Maps give context to the view. For example, the distance between the sunrise on June 21st and that on December 21st is 1.20 miles. The width of the Columbia River in this area is about 0.5 miles, and, adding another 0.1 miles for the distances on both shores, yields a distance of 0.6 miles from my view to the horizon. That's about half the length between the two sunrises. Therefore, a person standing in the sunroom needs to swivel their head about 45° to view the sunrise in the southeast on December 21st and 45° to the northeast for June 21st. Thus, we can visualize how large the sunrise region appears to be.

The distance between sunrises on May 22nd and May 29th is much larger than that between June 20th and June 26th. Likewise, the distance between the sunrises on November 25th and December 8th (13 days) is about 2½ times the movement between December 8th and December 21st. In other words, the sunrise location moves more quickly along the horizon at the equinox; by the solstice, it’s traveling quite slowly.

On the other hand, the distances between sunrises are about the same for the following time intervals: (1) September 15th to September 25th, (2) September 20th to September 29th, (3) October 7th to October 17th, and (4) October 11th to October 21st. Therefore, the location of the sunrise travels at about a constant speed during this time of year.

To help show the changes throughout the year, I plotted the sunrise’s motion along the horizon. I did the same for the time of sunrise. To do this, I first had to calculate the distance along the horizon. The first step is to find the distance between the distance markers. Since Google Maps does not provide information in the farming region, we use a combination of additional photographs and Google Maps. For example, suppose a photo contains two houses and two trees. The aerial view of Google Maps determines the distance between the two houses, but not that between the two trees. Since one distance is known, the photo is now used to determine the distance between the trees. A series of such photos establishes the distance between the distance markers.
Using this distance information, we can plot the sunrise location against the date to see how the sunrise moves along the horizon throughout the year. These measurements follow a sine wave, an expected behavior since the year and seasons are periodic occurrences.
This behavior confirms that the sunrise location changes slowly at the solstices and quickly at the equinoxes.
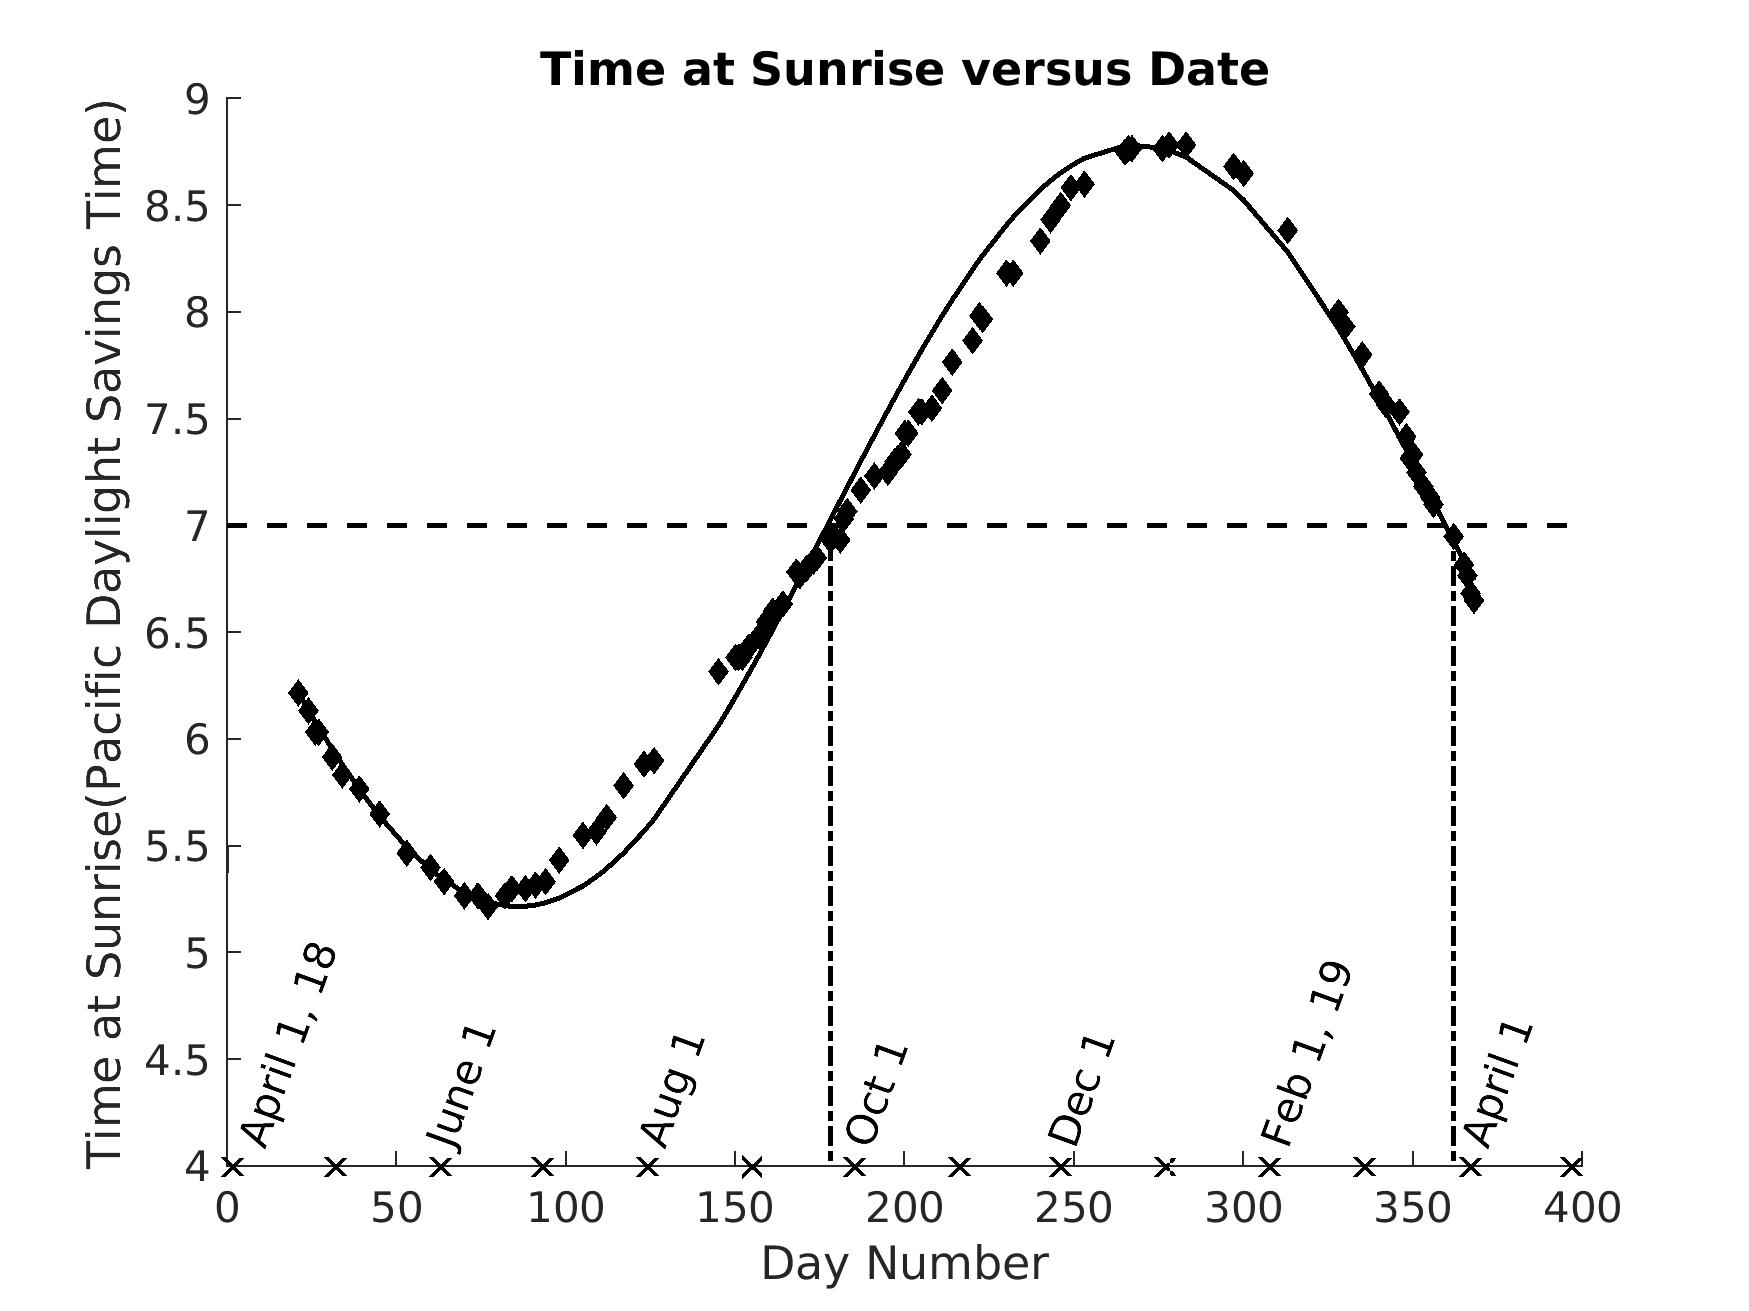
Likewise, the time of sunrise also changes sinusoidally as days go by. But while the sine wave fits the location data well, the sunris0e time data deviate from the sine wave before and after the fall equinox. The uneven horizon may be to blame; some sunrises occur at the ground level while others occur over the roof of a home, for example.
The plot of sunrise times predicts slightly later dates for the fall and spring equinoxes, but the sunrise time is exactly that anticipated, 7:00 a.m. PDST.
Before moving to Richland, I vaguely realized that the position of the sunrise changes with the seasons, but I did not have a clear field of view to observe that in detail. So, one of my goals was to share the amazing views with others. I hope you now will observe the sunrise more often, if possible, and see how slowly it travels near the solstice and how quickly, near the equinox, as these photos demonstrate.


Comments
Anthony Barreiro
May 29, 2020 at 6:35 pm
This is a wonderful project! Thanks very much for sharing it.
You're fortunate to have an open, relatively flat horizon from the northeast to the southeast, and I admire you for making such diligent good use of it! From my urban back porch I can see the Sun rise over a gently sloping ridgeline a couple of miles to my east for about a month before and a month after the equinoxes. I try to observe each sunrise during these times, noting both the time of sunrise and the azimuth, with a solar filter and a hand bearing compass.
I believe the variance between predicted and observed times of sunrise may be accounted for by the equation of time. You're using daylight saving time, which marks each noon exactly 24 hours after the previous noon. True noon, a.k.a. local apparent noon, occurs when the Sun is due south. The Earth's elliptical orbit around the Sun and the inclination of the Earth's axis of rotation to the plane of her orbit around the Sun make local apparent noon drift up to 14 minutes later than the mean noon in February, and up to 16 minutes earlier in November, with smaller maximum wiggles in May and July. The equation of time is zero on only four days each year, in April, June, August, and December. If you calculate sunrise time before local apparent noon for each day, I think you may get a better fit to the predicted sinusoidal curve.
https://en.wikipedia.org/wiki/Equation_of_time
https://equation-of-time.info/work
On September one, trust the Sun.
Come Halloween, subtract sixteen.
On Christmas Day, you're OK.
For your Valentine true, add a dozen and two.
The mid of month four, add no more.
At the mid of May, take four away.
On June fourteen, don't add a bean.
When August begins, add seven little mins.
The rest is easy: for any date, All you do is interpolate.
a poem by Tad Dunne
You must be logged in to post a comment.
Margaret Stautberg GreenwoodPost Author
November 15, 2022 at 7:15 pm
Thank you very much. I certainly enjoyed working on this project. I have just published an article in THE PHYSICS TEACHER magazine in the November issue. The DOI number is: DOI 10.119/5.0038965
Margaret Greenwood
You must be logged in to post a comment.
Mirjana
November 15, 2022 at 4:18 pm
Your photos and accompanying text are very useful. Thank you. I also read your recent article in Physics Teacher. Mirjana Božić
You must be logged in to post a comment.
Margaret Stautberg GreenwoodPost Author
November 15, 2022 at 7:19 pm
Thanks for your comment. Also nice to see that someone is reading my article
in THE PHYSICS TEACHER.
Sincerely,
Margaret Greenwood
You must be logged in to post a comment.
Margaret Stautberg GreenwoodPost Author
November 15, 2022 at 7:24 pm
My article entitled, "Geometry and the Cause of the Seasons: The Changing Hours of
Daylight and Elevation Angle of the Sun at Noon," has just been published in the November
issue of THE PHYSICS TEACHER magazine. DOI 10.1119/5.0038965
The entire article appears online.
Margaret Greenwood
You must be logged in to post a comment.
You must be logged in to post a comment.