 0
0Spacecraft are returning sights and sounds from Venus, Jupiter, and beyond — here’s a sampling.
Seven Minutes at Venus
On its ever-tightening orbits around the Sun, NASA's Parker Solar Probe swings by Venus for rerouting purposes. But one does not simply pass by our sister planet without taking some data.
Parker’s third flyby on July 11, 2020, took it just 833 kilometers (517 miles) above the planet’s surface. While the spacecraft was well above the thick atmosphere, it went close enough to pass through Venus's ionosphere, the sparse layer of charged particles surrounding the planet.
Parker’s FIELDS instrument, which measures electric and magnetic fields, detected a low, plasma-wave-induced hum from the ionosphere during closest approach that lasted seven minutes:
The data confirm that now that the Sun is at the minimum of its 11-year activity cycle, Venus’s ionosphere is much thinner than it was when the Pioneer Venus Orbiter last measured it directly, in 1992, back when the Sun’s activity was peaking. The change is expected, since Venus doesn’t boast a planetary magnetic field and responds directly to solar activity, but quantifying the change will help astronomers gain a better understanding of Venus’s atmosphere and its gradual escape to space.
Read more in NASA’s press release and in Geophysical Research Letters.
See Jupiter in Another Light
The king of planets offers a study in contrasts in a trio of images that highlight extreme weather on Jupiter. Hotspots glow bright at infrared wavelengths but appear brown in visible light, while the greatest storm that shows up red at visible light becomes dark at other wavelengths. Explore the images below with an eye for some key features.
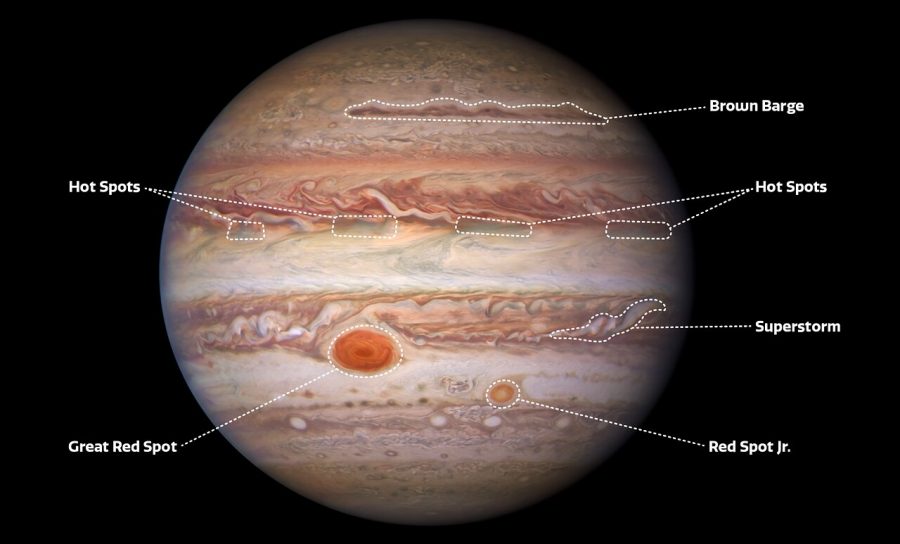
NASA/ESA/NOIRLab/NSF/AURA/M.H. Wong and I. de Pater (UC Berkeley) et al.
Jupiter’s Great Red Spot stands out for its darkness at ultraviolet wavelengths. That’s because the same molecules that give the anticyclone its distinctive red color absorb blue and ultraviolet light. In the infrared image, though, the storm’s thick, swirling clouds block radiation from the planet so that the Great Red Spot nearly disappears from the image altogether. Red Spot Jr., also known as Oval BA, follows the same wavelength-dependent pattern.
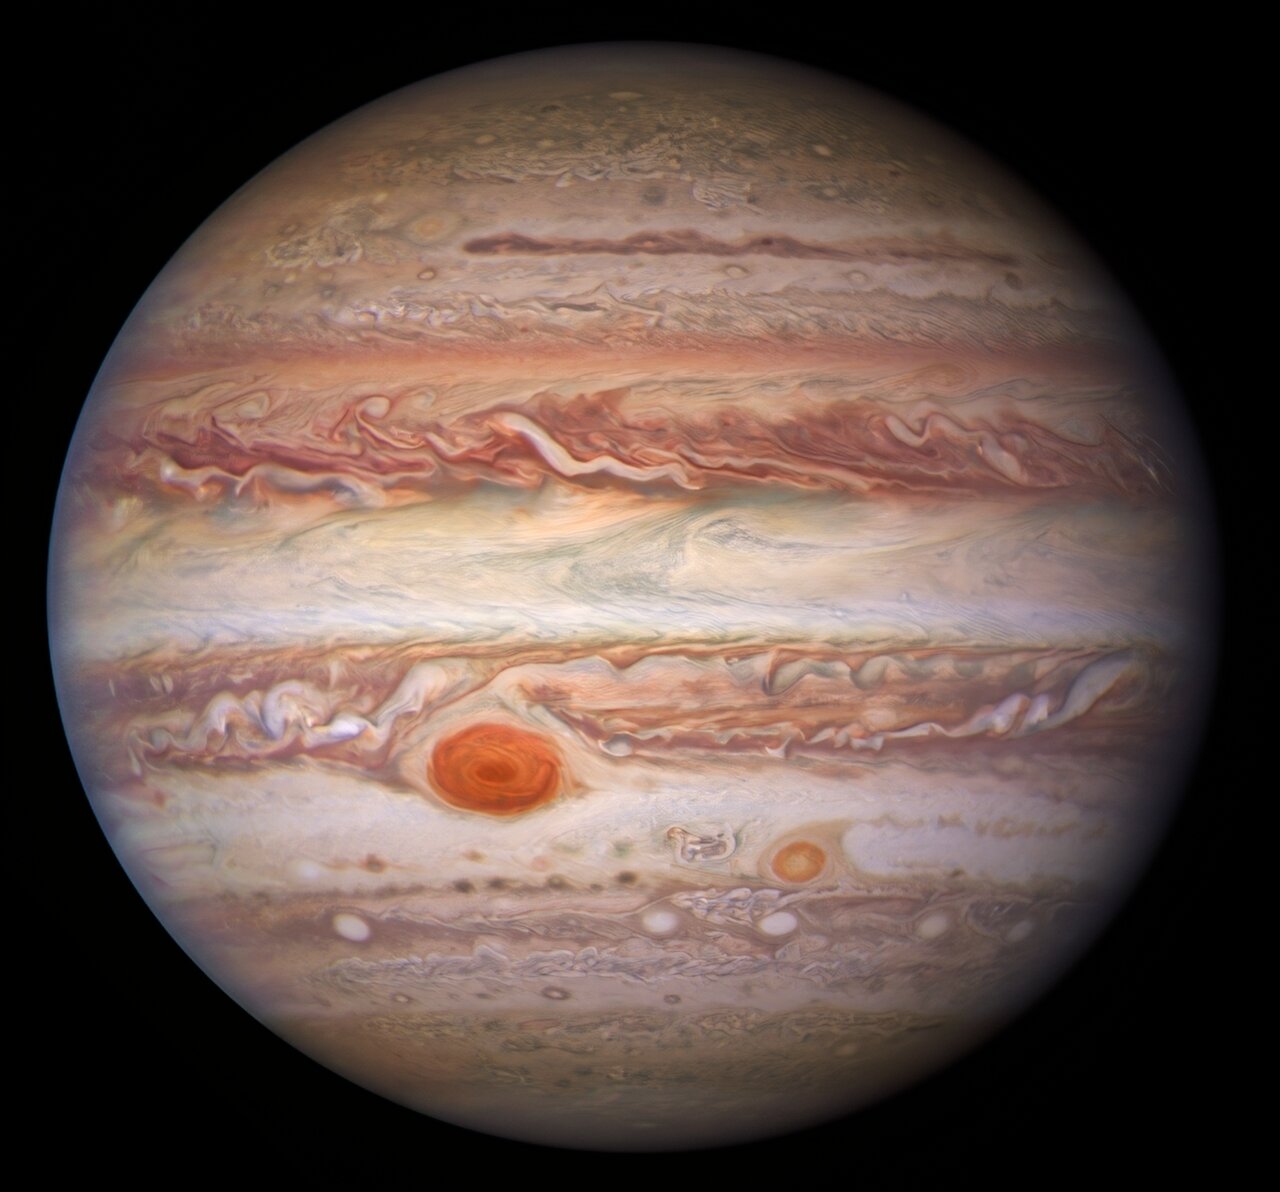
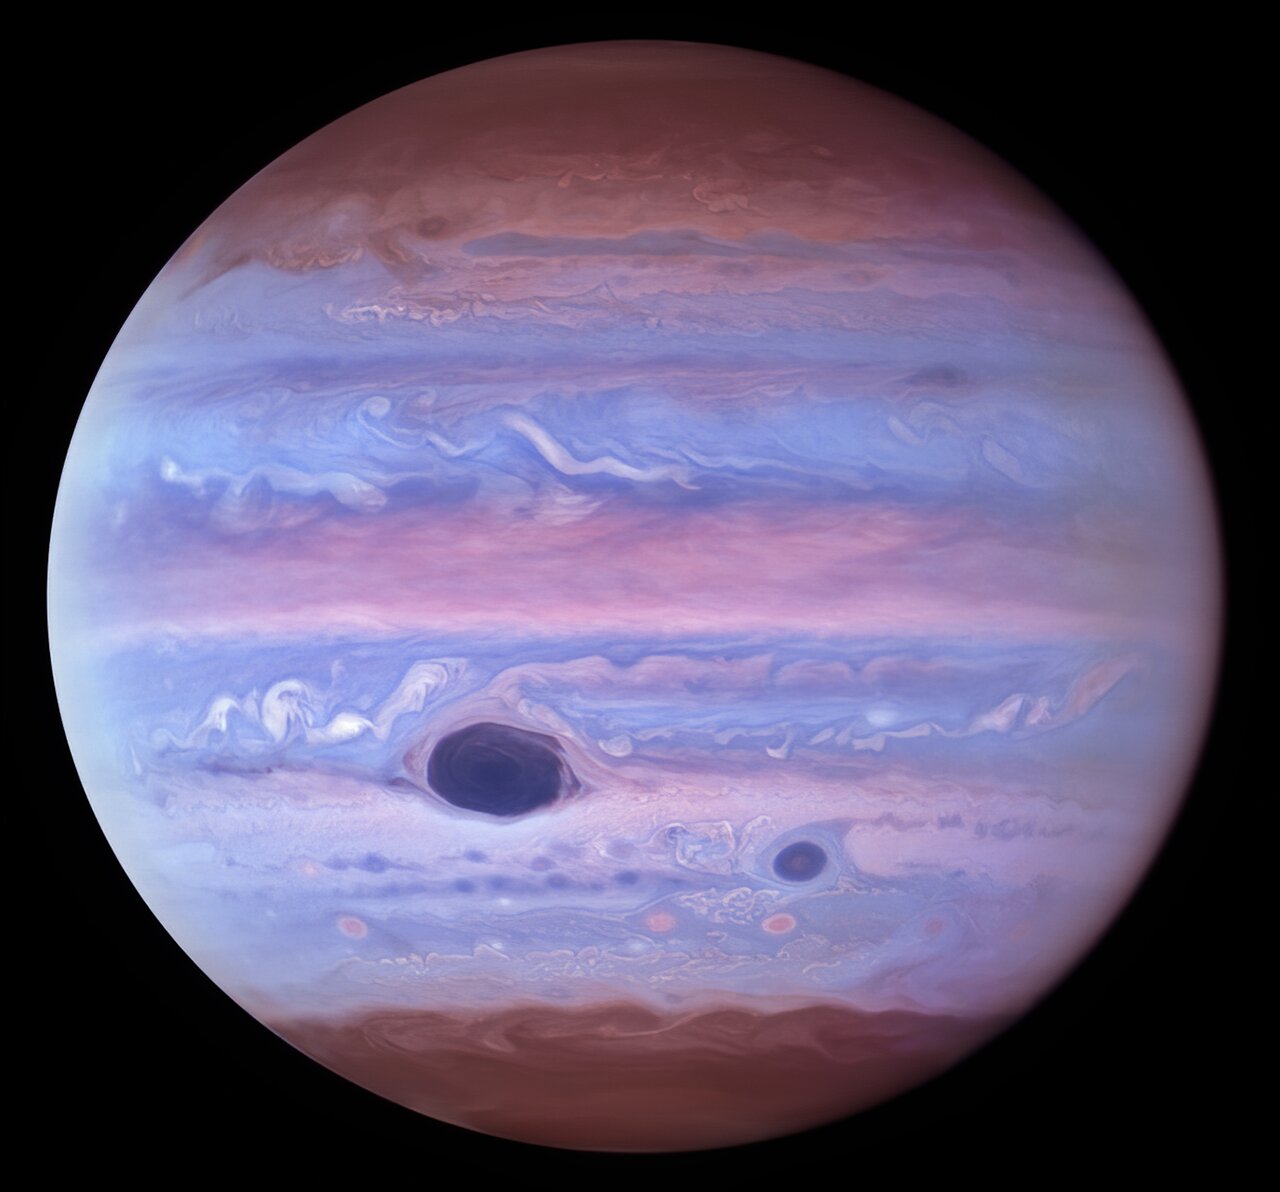
The counterrotating layers of clouds, on the other hand, remain prominent at all wavelengths. However, the stripes fade near the darkened poles in the ultraviolet image, as haze in the stratosphere absorbs increasing amounts of ultraviolet photons.
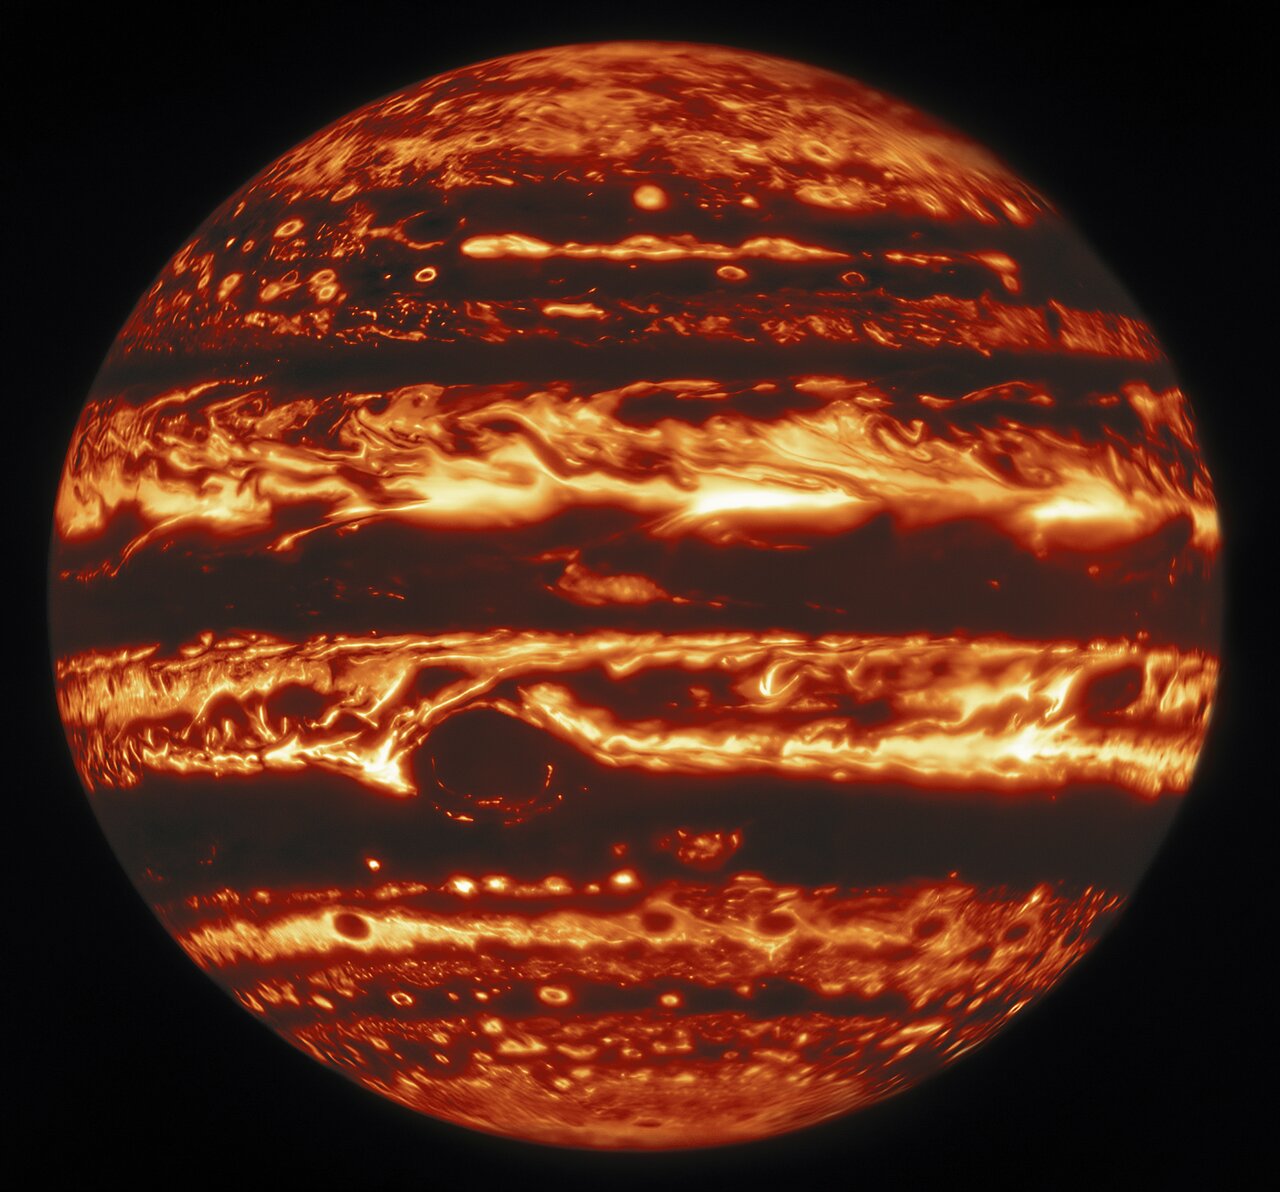
The visible and ultraviolet views were captured by the Wide Field Camera 3 on the Hubble Space Telescope, while the infrared image comes from the Near-Infrared Imager (NIRI) on the Gemini North telescope in Hawaiʻi. The images shown here, taken on January 11, 2017, were part of a longer campaign to track weather patterns on the planet.
Read more in NOIRLab’s press release and in the Astrophysical Journal Supplement Series.
Voyager 1 Hears Interstellar “Hum”
Voyager 1 sailed out of the solar system in 2012 when it crossed the heliopause, the boundary that separates the magnetic bubble surrounding our Sun from interstellar space. Now in the space between stars, it’s still sending back signals detected by its Plasma Wave Subsystem instrument. The signals contain occasional “whistles,” caused by sudden increases in density, many of them caused by eruptions from our own Sun. But tucked amongst the louder signals is a faint, low-frequency hum that’s coming from the sparse material spread out across the near-vacuum of space.
Stella Koch Ocker (Cornell University) and colleagues used the signal they found to study the density of interstellar material. The signal has persisted from 2017 onwards, as Voyager 1 has crossed 10 times the distance between Earth and the Sun. The team finds the density is changing over time (and space) in a way that traces turbulence traveling through the plasma that’s spread out between the stars.
Sadly, there’s no audio translation of this signal just yet, but you can see the low-frequency hum in the figure below. If the thin, persistent line extending from 2017 onward were translated into sound, it would be nearly a single tone because its range of frequency is so narrow.
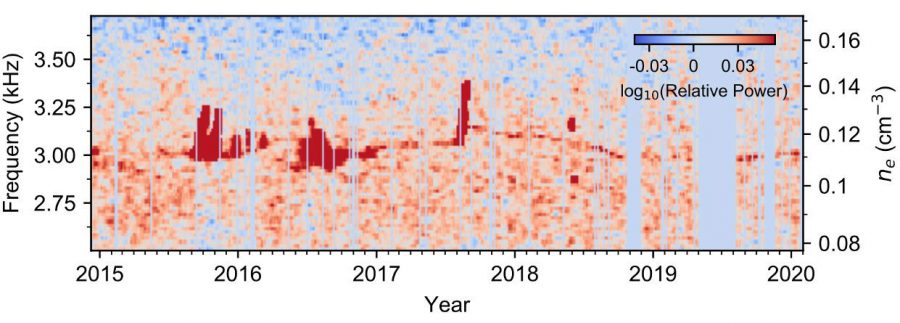
NASA / JPL-Caltech / Stella Ocker
Read more in NASA’s excellent press release and in Nature Astronomy.
About Monica Young
Monica Young, a professional astronomer by training, is News Editor of Sky & Telescope.


Comments
You must be logged in to post a comment.