 2
2Results from a complex new analysis support cosmologists’ suspicions that something is missing from our understanding of the universe.
For the most part, our standard theory of cosmology fits observations like a glove. With just a handful of ingredients, scientists can explain the patchy pattern of the cosmic microwave background (CMB) — the relic radiation from the universe’s primordial age — and how the nearly uniform soup it came from transformed into the Swiss cheese of galaxy clusters and cosmic voids we see today.
But some nagging problems remain. The most touted is the Hubble tension, a discrepancy between how fast the universe appears to be expanding today and how fast it “should” be expanding, based on what we see in the early universe. But there’s another, more subtle discrepancy: Today’s universe is too smooth.
For the past decade, a suite of studies have all found that cosmic structure isn’t clumpy enough. The CMB’s patchiness reveals how lumpy the primordial soup was, and those little lumps should have grown into big lumps — galaxy clusters. Yet we only see half as many big galaxy clusters as predicted.
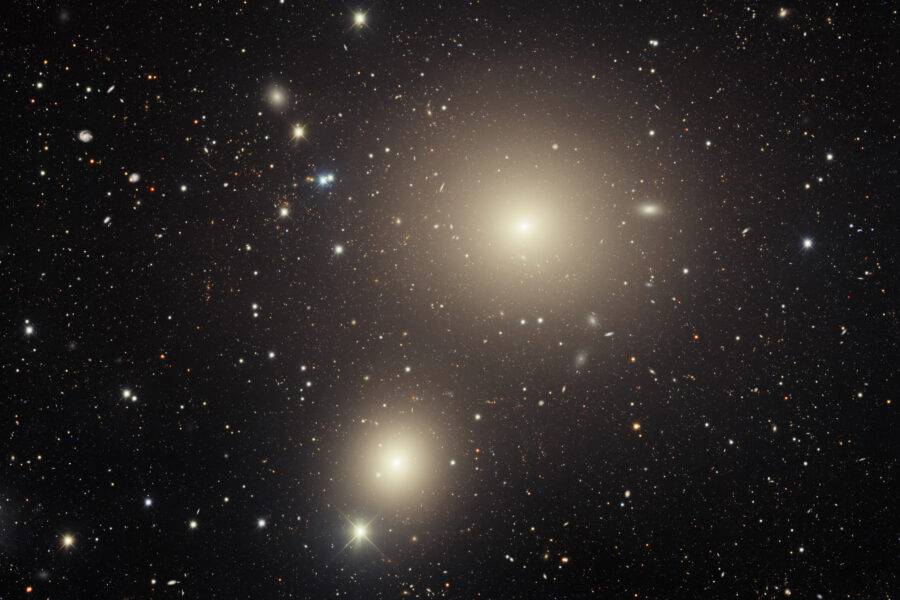
CTIO / NOIRLab / DOE / NSF / AURA, Acknowledgment: Image processing: T. A. Rector (University of Alaska Anchorage / NSF’s NOIRLab), J. Miller (Gemini Observatory / NSF’s NOIRLab), M. Zamani (NSF’s NOIRLab) & D. de Martin (NSF’s NOIRLab)
A new analysis, reported in three papers in Physical Review D, continues the trend. More than 150 scientists from the Dark Energy Survey and South Pole Telescope collaborations joined forces in the work. They used data from both DES and SPT, as well as archival data from the Planck spacecraft, to study large-scale cosmic structure in a large section of the Southern Hemisphere sky.
These instruments observe the universe in distinct ways. DES is a huge galaxy survey, imaging hundreds of millions of objects; SPT and the retired Planck map the CMB. Each set of measurements has its own limitations, but those limitations arise for different reasons. By mixing and matching data sets, astronomers can in a sense cancel out some of those limitations, making the result stronger.
The researchers combined galaxies’ positions, the distortions created in galaxies’ images by matter between us and the galaxies gravitationally lensing the light, and lensing distortions in the CMB’s patchy pattern by that same intervening matter. This complex comparison gave the scientists a unique look at matter’s distribution over the past 8 or 9 billion years.
The discrepancy remains, albeit weakly.
Other studies have combined galaxy surveys and CMB lensing measurements before, but this is the first study to combine these three data sets in this way. Chihway Chang (University of Chicago), who helped lead the papers, says that their work’s main contribution is to demonstrate the power of this approach.
“These are extremely interesting papers that are very well done and highly convincing,” says Hendrik Hildebrandt (Ruhr-Universität Bochum, Germany), who co-leads DES’s “friendly competitor,” the European Kilo-Degree Survey (KIDS). “It’s fair to say that these papers present the most comprehensive and thorough study in this area yet.”
The clumpiness tension (or more specifically, the S8 tension, which describes the amount of gravitational lensing observed) is less pronounced than the Hubble tension: The former has roughly a 1% to 15% chance of being a fluke, while the latter’s flukiness potential appears to be much smaller than 1%. However, scientists haven’t tracked down any errors in the measurements that can easily explain the lack of lumps — especially since studies use different methods and data sets. Furthermore, fixing the clumpiness parameter tends to exacerbate the Hubble tension, and vice versa. “Thus, looking for a cosmological model accommodating both the tensions is not a cup of tea,” a team of scientists (including Hildebrandt) wrote in an extensive review of outstanding cosmological oddities.
References:
Y. Omori et al. (DES and SPT Collaborations). “Joint analysis of Dark Energy Survey Year 3 data and CMB lensing from SPT and Planck. I. Construction of CMB lensing maps and modeling choices.” Physical Review D. Published January 31, 2023.
C. Chang et al. (DES and SPT Collaborations). “Joint analysis of Dark Energy Survey Year 3 data and CMB lensing from SPT and Planck. II. Cross-correlation measurements and cosmological constraints.” Physical Review D. Published January 31, 2023.
T. M. C. Abbott et al. (DES and SPT Collaborations). “Joint analysis of Dark Energy Survey Year 3 data and CMB lensing from SPT and Planck. III. Combined cosmological constraints.” Physical Review D. Published January 31, 2023.
E. Abdalla et al. “Cosmology Intertwined: A Review of the Particle Physics, Astrophysics, and Cosmology Associated with the Cosmological Tensions and Anomalies.” Journal of High Energy Astrophysics. June 2022.
About Camille M. Carlisle
Science Editor Camille M. Carlisle handles science features for Sky & Telescope. She specializes in black holes, Mars, and whatever she happens to be writing about at the time. Frolic with her through the delights of black holes in her blog, The Black Hole Files.


Comments
StanR
February 11, 2023 at 1:07 am
Probably I'm missing something, but wouldn't the filamentary structures of galaxies affect the observed clumpiness? (More clumps might be in front of other clumps than would be the case if clumps were random, for example.)
You must be logged in to post a comment.
Fire-Starter James
February 13, 2023 at 9:47 am
Hi, new guy here. Can anybody tell me why we don't use relativistic addition of velocity to describe Hubble's Law? I did the math and tried to show it to my professor in '81, but he didn't care to look at it or tell me what was wrong with it. (Fairly typical for Cornell professors, but unusual behavior for him.)
It predicts that we would observe lower expansion rates at greater distance, as sort of a mirage. It also doesn't need a Big Bang.
V(r1+r2) = ( V(r1)+V(r2) / (1 + (V(r1)*V(r2)) / C^2 )
You must be logged in to post a comment.
You must be logged in to post a comment.