 0
0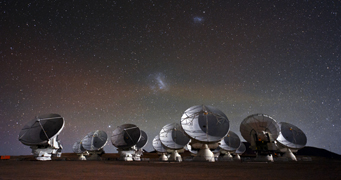
ALMA (ESO/NAOJ/NRAO) / C. Malin
In the November 2013 issue of S&T, I write about a revolutionary new telescope being built in the Chilean Atacama Desert. The Atacama Large Millimiter/submillimeter Array (ALMA) explores a little-known region of the electromagnetic spectrum, waves that are longer than the farthest infrared but shorter than radio waves. Submillimeter/millimeter waves come from frigid gas just tens of degrees above absolute zero; ALMA promises to see better than any other telescope in this wavelength range, unveiling secrets of star, planet, and galaxy formation.
ALMA's powers of observation come from a technique called interferometry. A specialized supercomputer combines signals from each pair of antennas to mathematically craft an image up to 10 times sharper than images from the Hubble Space Telescope.
Early Results
Already ALMA has produced some amazing results, and we've covered many of them at S&T:
- A spiral-shaped shell around R Sculptoris hints for the first time that this red giant star hosts an unseen companion. Previous observations by other millimeter-wavelength telescopes had revealed only a bland spherical shell.
- Millimeter-size dust grains in a dusty disk ringing a brown dwarf suggest that stars’ smaller cousins can grow their own planets.
- A sharp view of Fomalhaut’s massive dust ring suggests the presence of two shepherding planets, each with at most three times the mass of Earth.
- Gas streams around a star signal two gas giant planets sweeping up material, a key stage in planet formation.
- The spectrum of the young binary system IRAS 16293-2422 in the Rho Ophiuchi cloud revealed glycolaldehyde, a simple sugar and pre-biotic molecule.
- Observations of faraway galaxies bursting with stars revealed a gas reservoir that suggests star formation started as early as 500 million years after the Big Bang.
Observing in 3D
When an astronomer observes with ALMA, they receive their observations in a "data cube," a two-dimensional picture where each pixel contains a spectrum. An example of the data cube can be seen in the below video of the giant, aging star R Sculptoris (though "data sphere" would be a more apt description in this case). The data is visualized in two dimensions by slicing through the sphere, where each layer represents a different frequency. Each frequency in turn translates to a different speed of the gas ejected from the star. R Sculptoris blows a wind that turns spiral-shaped as the dying star orbits an unseen companion; the spiral is most easily seen halfway through the video. (All the gas in this image comes from the stellar wind; the binary star system is hidden in the center.)
Interferometry with ALMA
The following video tells you a little more about how astronomers use interferometry to obtain images from ALMA. The video is aimed towards astronomers filling out proposals for observing time, but the illustrations clearly show how ALMA combines information from pairs of antennas separated by various lengths.
Want to get into the nitty-gritty details and try it for yourself? Wolfram, the software company that designed Mathematica, features a neat little (free) tool that allows you to try out different antenna configurations and see what ALMA sees. Check out the interferometry tool here.


Comments
You must be logged in to post a comment.