 6
6New observatories in space and on the ground are providing us with our best views yet of the Sun — providing insight into puzzles that have remained unsolved for decades.

ESA & NASA / Solar Orbiter / EUI Team, D. Berghmans (ROB) & ESA / Royal Observatory of Belgium
Three missions this week have unveiled unprecedented views of the Sun and its atmosphere, the solar corona. Meanwhile, the best solar observatory on the ground is providing the sharpest view ever of the Sun's surface. From first-ever views of the Sun's south pole to wide-angle views that encompass an explosion of particles on their way toward Earth to surprising stripes on the visibile surface, we now have the potential to solve solar mysteries that have plagued scientists for decades.
First Views of the Solar South Pole
The European Space Agency's Solar Orbiter, launched in 2020, has just obtained its first views of the Sun's turbulent south pole. The orbiter's mission is to circle the Sun at ever more tilted angles to glimpse our first views of our star's poles. The spacecraft is now at 17° relative to the ecliptic, the plane on which Earth and the other planets orbit.
The only other spacecraft to take polar data was the Ulysses mission, which launched in 1990, but it didn't carry cameras. All of our other solar-observing spacecraft orbit within the ecliptic, either circling Earth or the Sun. The Solar Orbiter has managed to leave the ecliptic plane by slinging past Venus four times so far. By 2029, after another three Venus flybys, the Solar Orbiter will obtain an angle greater than 33°.
The Sun's poles offer key clues to deciphering its 11-year cycle, on which the number of sunspots, flares, and explosions known as coronal mass ejections (CMEs) wax and wane. The cycle comes about due to the magnetic fields on the Sun: At the beginning of any given cycle, those fields are calm and ordered, like the magnetic field around a simple bar magnet. But the Sun isn't solid, and its equator turns around a full 11 days faster than its poles. The magnetic field, in the process, is wound up, and the turbulent mess that results creates the sunspots, flares, and CMEs that we see. At the peak of the frenzy, the magnetic poles switch, and the fields calm down again.
Scientists don't know exactly what drives the cycle, or why it takes roughly 11 years. To get a fuller picture of the change of activity and the swapping of the poles, a view of the poles is essential. We're currently near the peak of solar activity; by 2029, the Sun will be well on its way to the minimum. The Solar Orbiter will thus watch the solar poles throughout the cycle.
ESA & NASA / Solar Orbiter / PHI Team, J. Hirzberger (MPS)
The first views of the south pole are already providing us with a glimpse of what happens when the field is in a frenzy: The south pole is a mess. A bar magnet would have just a single polarity (north or south) at its pole, but the Polarimetric and Helioseismic Imager shows that the Sun has weak patches of both. After the field flips, the poles should settle to a single polarity.
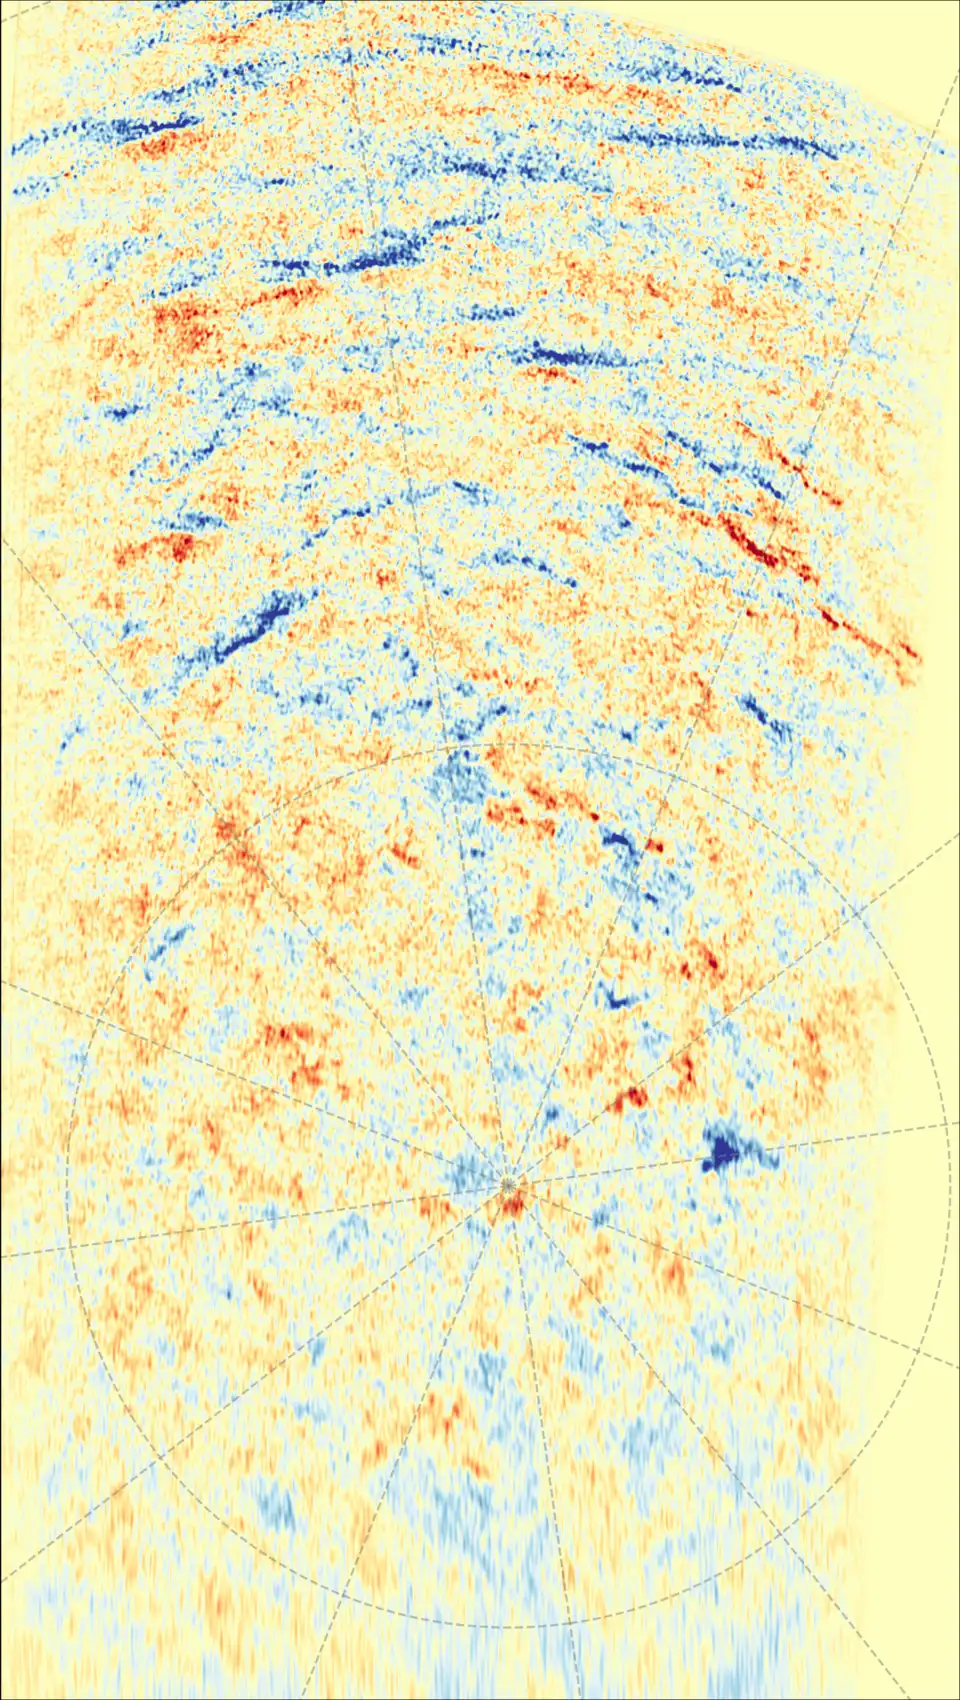
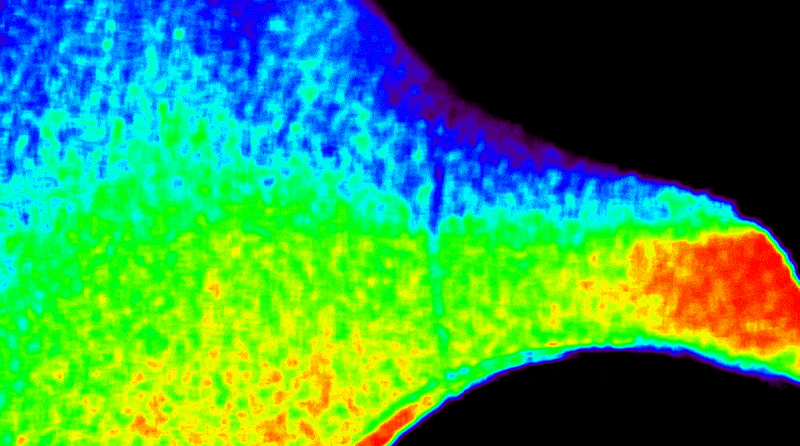
Meanwhile, the Spectral Imaging of the Coronal Environment (SPICE) instrument measured the light emitted by ionized carbon atoms in the transition region, a thin layer between the photosphere and the corona where the temperature rapidly increases. Understanding what happens in this region will help astronomers figure out how the solar corona becomes so hot, at a million degrees, when the photosphere is only several thousand degrees. The ionized carbon atoms are at a temperature of about 32,000°C.
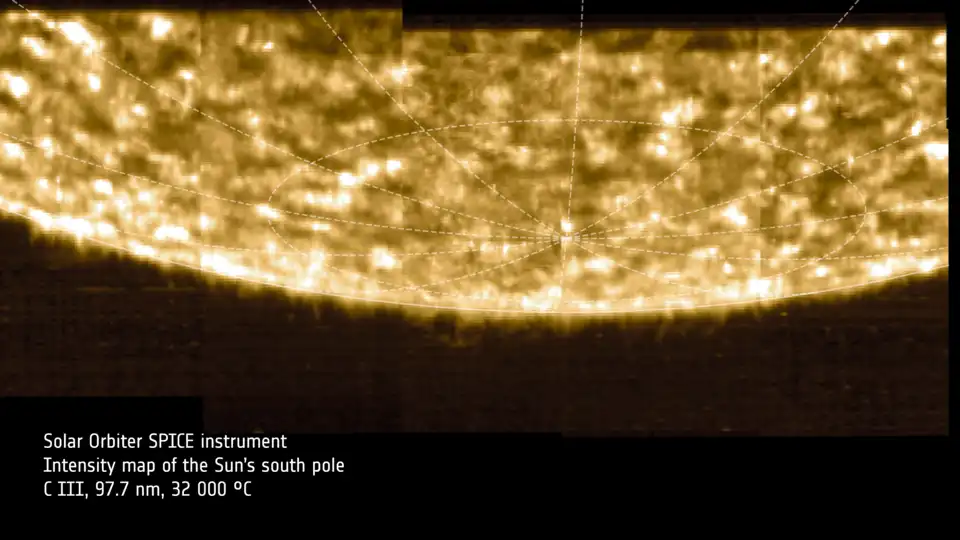
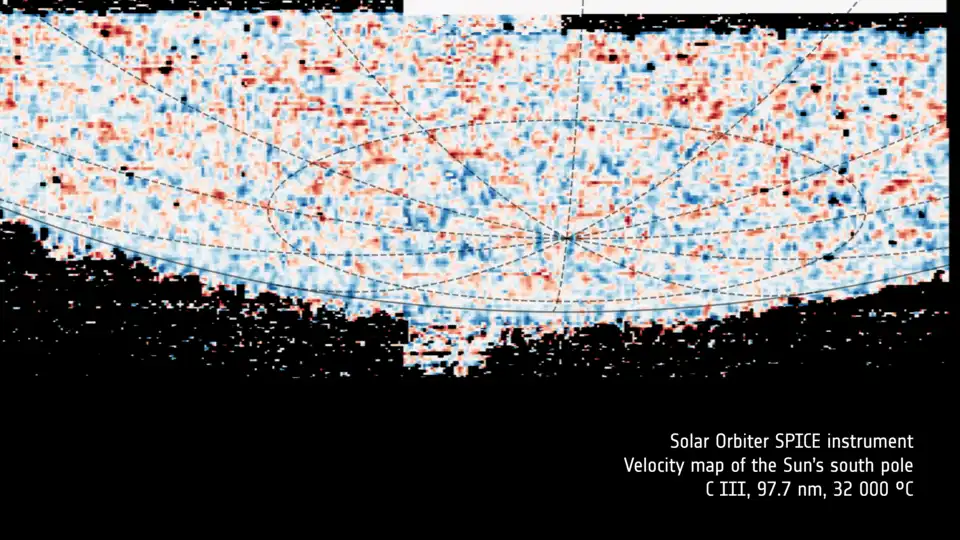
The left image shows an intensity map, revealing the locations of clumps of carbon ions. The right image shows a velocity map, where blue and red indicate how fast the carbon ions are moving towards and away from the Solar Orbiter spacecraft, respectively. Darker blue and red patches are related to plasma flowing faster due to small plumes or jets.
ESA & NASA / Solar Orbiter / SPICE Team, M. Janvier (ESA) & J. Plowman (SwRI)
Widest Views Ever of the Solar Corona
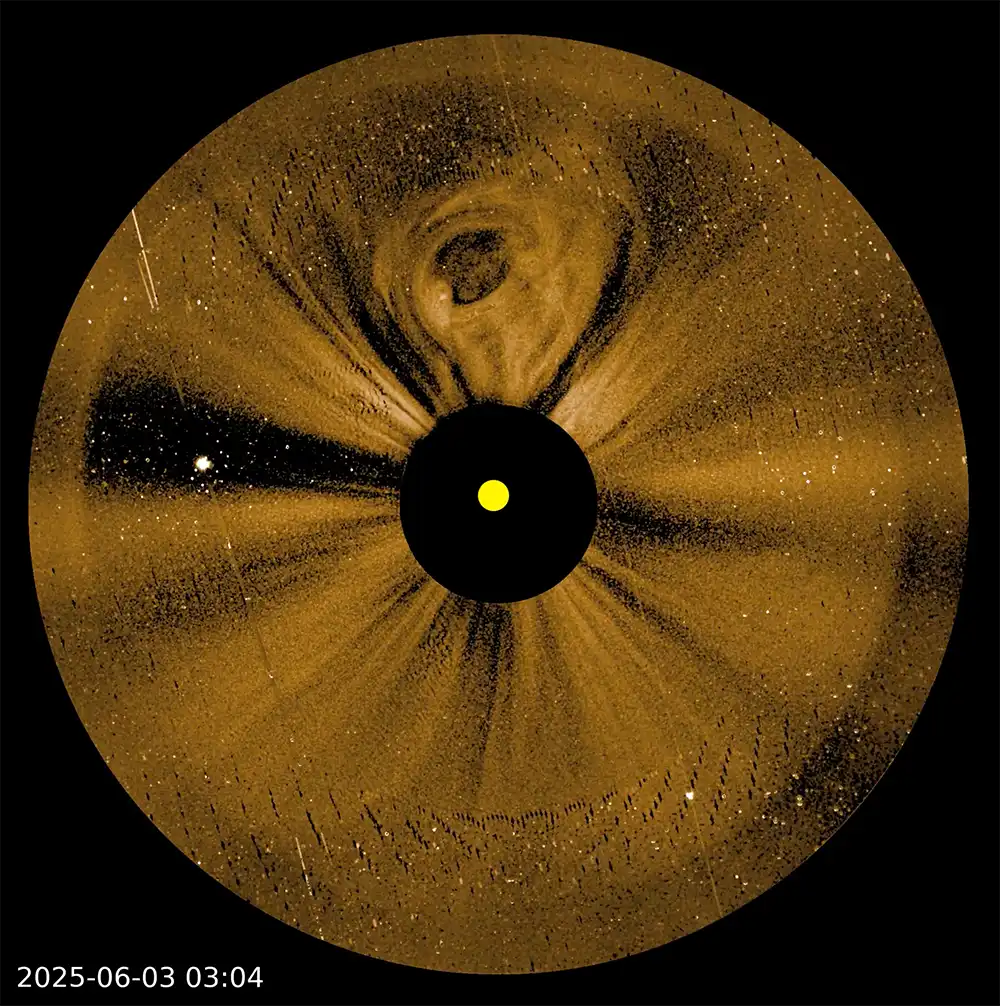
Another new view of the Sun comes from closer to home: The Polarimeter to Unify the Corona and Heliosphere (PUNCH) mission combines three wide-field cameras and one narrow-field camera on four spacecraft in Sun-synchronous Earth orbits. The data from the four cameras are combined into a single image that captures solar activity as it passes out into the wider solar system.
"Our mission is to identify and understand the corona and the solar wind that fills the solar system as parts of a single, unified system," said PUNCH principal investigator Craig DeForest (Southwest Research Institute). He presented the mission's preliminary data at the 246th meeting of the American Astronomical Society in Alaska.
The mission is still in the commissioning phase, as the spacecraft are still drifting into their correct relative positions to conduct science observations. But they're close enough to those positions now that the team is releasing a first view of what we can expect to see:
The video above shows multiple CME particle explosions: one heading north off the Sun and one heading straight for Earth. The view of the latter, which happened just a week ago, is unprecedented, says DeForest. "You're seeing something that's literally washing across the entire sky of the inner solar system as it comes toward Earth," he notes. "In fact, we were able to track that . . . CME, [which was traveling] at 4 million miles an hour, until just a little under two hours before it impacted Earth." (That CME was the one that led to widespread aurora on the weekend of May 31st.)
The image below zooms in on the narrow-field view, to show the incredible detail the camera captures of CMEs while they are still near the Sun, before they've expanded out into the solar system.
NASA / SwRI
"These are preliminary data," DeForest says. "They look good now, but they are going to look fabulous once we're done with calibration later this summer."
A view Into the Solar Corona
While PUNCH views the evolution of space weather as it heads toward Earth, a new instrument that just became operational on the International Space Station in December 2024, the Coronal Diagnostic Experiment (CODEX), is providing new information about the solar wind as it forms. To view the faint corona, CODEX blocks out the Sun with occulting discs about the width of a tennis ball, each one held aloft on three metal arms.
"CODEX is a next-generation solar coronagraph," says mission science lead Nicholeen Viall (NASA Goddard Space Flight Center), who presented the instrument's first results at the same meeting of the American Astronomical Society. "The traditional coronagraphs, like what we saw in PUNCH and previous coronagraphs, measure density — electron density. CODEX is special because it also measures temperature and velocity, which means that we can really get the energetics in the solar corona and in the solar wind."
NASA / ESA / SOHO / KASI / INAF / CODEX
By knowing not just how much material there is in the corona but also how hot it is as well as where it's going, scientists can start to get a sense of what happens to this wind as it flows off the Sun and into the solar system. Click on the image above and you'll see it's not a smooth flow but rather blows in hot gusts. What causes those gusts is an open question that CODEX was designed to answer, Viall says. One key to solving it is magnetic reconnection — the snap of stressed magnetic field lines that might releases hot gas into the solar wind.
Sharpest Views Yet of the Solar Surface
Even as new missions launch to space to provide new information about the Sun's atmosphere, the Daniel K. Inouye Solar Telescope in Hawai'i is providing stunning views of the solar surface. Able to resolve features only 20 kilometers (12 miles) across, Inouye has been providing us with unique views of the Sun's visible surface since the telescope began science operations in 2022.
The latest of these is a new view of granulation: the convective cells that are often compared to the bubbles that form in a pot of water. But on the Sun, there's not only heat, there's also magnetic fields. New observations show that the magnetic fields line granule walls, resulting in rippling bright and dark stripes.

NSF / NSO / AURA

NSF / NSO / AURA
These stripes represent magnetic changes of just 100 Gauss — comparable to a typical refrigerator magnet. While subtle, these changes are enough to change the density and temperature of the gases on the Sun's visible surface, resulting in the dark (denser/cooler) and bright (sparser/hotter) regions. David Kuridze (National Solar Observatory) and colleagues published the results in the May 20th Astrophysical Journal Letters.
Together, the pantheon of solar observatories are helping us understand the mysterious behaviors of our nearest star.
About Monica Young
Monica Young, a professional astronomer by training, is News Editor of Sky & Telescope.


Comments
AB
June 14, 2025 at 12:06 am
Is it my browser, or is this page a real mess? The text is in multiple 1-inch columns over top of a video, and no other pictures visible.
You must be logged in to post a comment.
Monica YoungPost Author
June 16, 2025 at 1:26 pm
Dear AB,
Hmm, I do see that for a moment, but then the page fully loads and all the images and videos are visible. Did you wait to see if the page would load fully? Or did it just not fully load? If the latter is true, and if you have time, could you email us at [email protected] with the details of your browser and operating system so we can try to troubleshoot?
Thanks,
Monica
You must be logged in to post a comment.
AB
June 23, 2025 at 12:27 am
Glad to see the article is back, in this week's newsletter. So I can read it now, and see most of the pictures. There are just a couple of big blank spots, in the "Widest views ever" section, one after the first paragraph and one after "a first view of what we can expect to see:"
Definitely better! I'm using Edge version 137.0.3296.93. Yes, I did wait, and try to reload.
You must be logged in to post a comment.
Monica YoungPost Author
June 24, 2025 at 11:18 am
Dear AB,
Thank you for your patience and for trying again! I'm glad that most of the post shows up for you now. We're still working out some kinks with the video players, so future posts won't have the same problem!
~ Monica
You must be logged in to post a comment.
gmk
June 17, 2025 at 4:57 am
Given that the ecliptic is inclined ~7° to the Sun's equator, the north and south poles of the Sun are alternately visible from Earth at certain times of the year during our orbit around that star. Not to minimize what Solar Orbiter is accomplishing, but calling that spacecraft's views the "first-ever views of the Sun's south pole" is an exaggeration.
You must be logged in to post a comment.
Monica YoungPost Author
June 25, 2025 at 9:41 am
Quite true, and thank you for pointing that out! What's unprecedented about the Solar Orbiter views is their degree (that is, a higher angle than we've ever had before) and their clarity.
You must be logged in to post a comment.
You must be logged in to post a comment.