6
6After decades of searching, scientists have finally found a clear sign of active volcanism on Venus.
NASA / JPL-Caltech
For decades, scientists have suspected that our sister planet has active volcanoes. Its surface is geologically young, perhaps only tens of millions of years old, meaning that lava has flowed on this planet in its recent past. The question has remained, though: How recent is recent?
Now, a new analysis of three-decade-old radar images from NASA’s Magellan orbiter has resulted in a definitive detection: In 1991, there was an active volcano on Venus.
“There have long been predictions for active volcanism on Venus, but we've never had evidence as strong as this,” says Paul Byrne (Washington University in St. Louis), who was not involved with the study.
Magellan orbited Venus between 1990 and 1994, before suicidally plunging into the hellish atmosphere. It burned up in the thick carbon dioxide air among sulfuric-acid clouds, never reaching the surface, where pressure is equivalent to diving a kilometer deep in Earth’s oceans.
Before the mission’s end, though, the spacecraft’s synthetic aperture radar mapped almost all of the Venusian surface. The maps show features as small as 120 meters (390 feet) across. (To give that some context, if there were a baseball field on Venus, Magellan would have just been able to see it.) These maps were then sent back to Earth, where they were stored digitally “on a relatively new storage device known as a compact disc,” Herrick explains with a smile. They’ve been a mainstay for Venus researchers ever since.
Magellan data are now available on NASA’s Planetary Data System. Emily Lakdawalla explains how to access and manipulate PDS data in the May 2018 issue of Sky & Telescope.
But only in recent years did in-depth probing of the surface become possible. While the data was digital, there was so much of it that only a small part of it became widely distributed right away.
“You need to be able to load in a few hundred–gigabyte data sets and pan around on the surface and zoom in and out,” says Robert Herrick (University of Alaska, Fairbanks). Herrick led a new study of the Magellan data, presented March 15th in Science and at the 54th Lunar and Planetary Science Conference in Woodlands, Texas. And he did it the old-fashioned way — by looking at the data himself.
“There's no automatic algorithm that will allow you to search for those changes,” notes team member Scott Hensley (NASA JPL). Computers have gotten quite good at pattern recognition, but it takes a special eye to spot the differences in Magellan images. While the spacecraft made multiple passes over the planet’s surface, its goal wasn’t to spot changes. Rather each pass brought with it new science goals and thus new image properties.
The biggest change between passes was the viewing angle at which the radar data was collected. It’s a bit like aerial photography, Herrick explains, in which on one pass you’re seeing the terrain illuminated one way by the Sun, and on the next pass, you’re seeing it illuminated the other way. The angle matters because radar can’t bounce off terrain that’s in shadow.
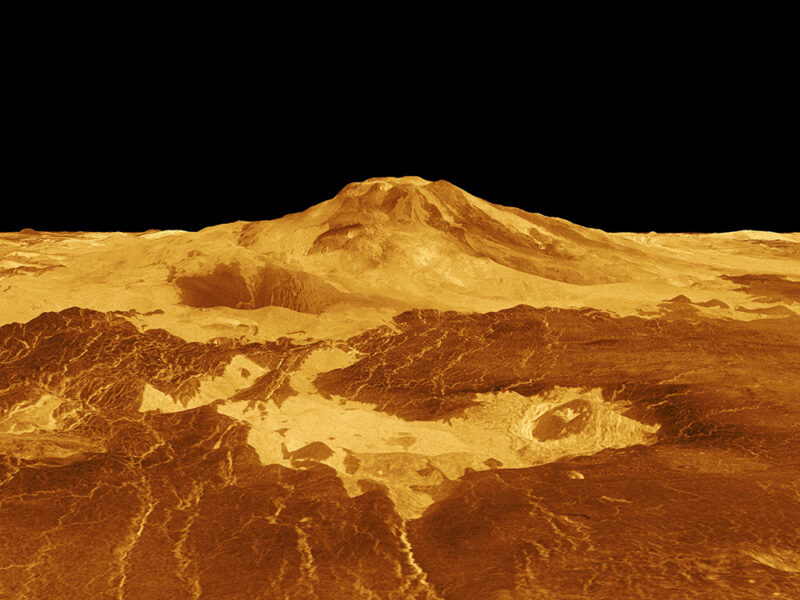
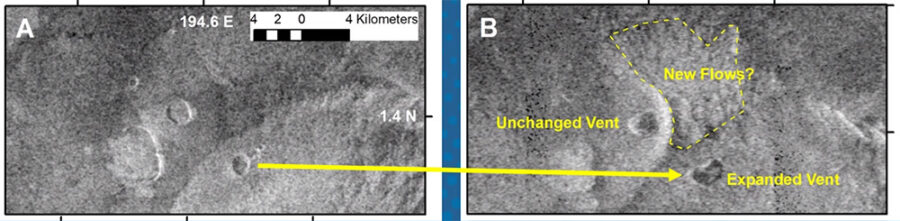
Since the search was manual, Herrick had to narrow his scope. “I had a list of my 50 top places that I was thought there might be new volcanism,” he says. And eventually, he hit pay dirt. On Maat Mons, which is itself a volcano, Herrick spotted a caldera that had enlarged over an eight-month period, changing from circular to kidney bean-shaped. The caldera also became shallower and its floor darkened, possibly indicating it had filled with lava.
R. Herrick
S. Hensley
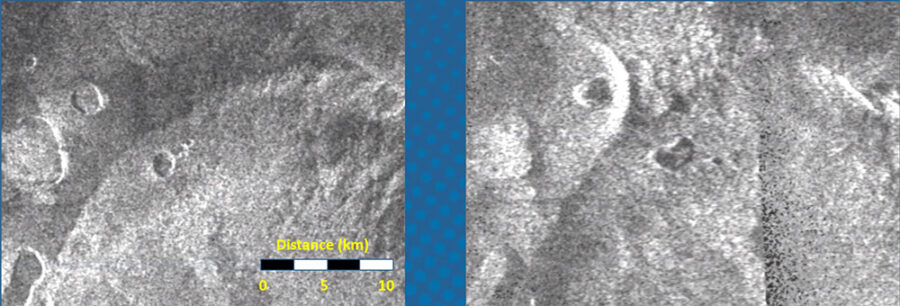
To verify that the detection wasn’t a trick of the light, so to speak, Herrick and Hensley used Magellan’s topography map to correct their radar images so that they both looked as if viewed from straight above, a process called orthorectification. They also used the available data to simulate what the caldera would have looked like during the second pass if it hadn’t changed shape. They conclude that the caldera’s changes in size, shape, and brightness are the real deal.
One scenario is that the first radar image caught the caldera after it had just erupted. “If the magma chamber is still down there and still getting fed every now and again, you might get a later eruption in the exact same place,” Herrick explains. “It might subsume that vent so you end up with a larger caldera, and the active magma is forming a lava lake in the interior.” Although the fuzzy images make it difficult to say for certain, he thinks this caldera could be acting much like Kīlauea in Hawai‘i, a shield volcano that erupted last year.
There might also have been accompanying lava flows, which show up in the second image as a brightened area north of the caldera. The lava would look different on Venus than on Earth, with the high temperature and surface pressure resulting in runnier flows. The changing illumination makes it difficult to say so for sure, though.
“It's not clear that there's been volcanic activity, i.e., stuff coming out of the ground,” Byrne says. “It's possible that what we're seeing in their new paper is magmatic activity, i.e., the movement of magma in the subsurface.”
“But either way,” he adds, “this finding is a big deal!”
Knowing that there’s not just recent but current volcanic activity on Venus influences our understanding of other processes taking place on the surface and even in the air — volcanoes might provide a basis for the chemistry needed to form the planet’s thick blanket of clouds.
There’s probably more volcanic action just waiting to be found. “I have looked at roughly 1.5% of the planet,” Herrick notes, “and about a little over 40% of the planet has actually been imaged twice.”
Within a decade or so, NASA’s VERITAS and ESA’s Envision will arrive at Venus, and the data they return will up the ante. VERITAS, now scheduled to launch in 2031 (a three-year delay from what was previously planned), will map the entire surface, resolving features down to 30 meters across. If Magellan could see a baseball field, VERITAS could make out the stretch from the pitcher’s mound to the outfield. Envision, too, will resolve down to 30 meters, but will map only about a third of the surface. Both missions will be making repeat passes with same-look geometry, which will make searches for surface changes much easier (and more easily automated). The missions’ topographical maps will also enable better analysis of the Magellan data, too.
“I don't think at its core this finding is surprising — but it's powerfully enabling,” Byrne says. “Now we have a better idea of what to look for with the new mission data that we'll get for Venus in the coming years.”
Editorial note (March 30, 2023): The researchers stated that the Venus volcano resembles the Kīlauea shield volcano on Earth, not Mauna Loa.
About Monica Young
Monica Young, a professional astronomer by training, is News Editor of Sky & Telescope.