 0
0NASA’s premier eye on the infrared sky is shutting down on January 30th, after operating more than three times longer than designed.
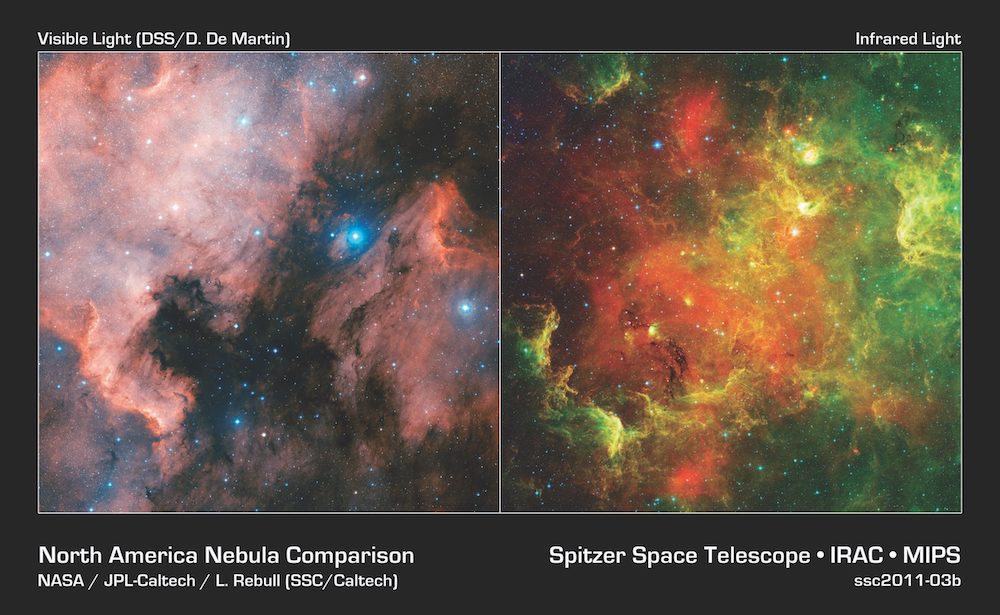
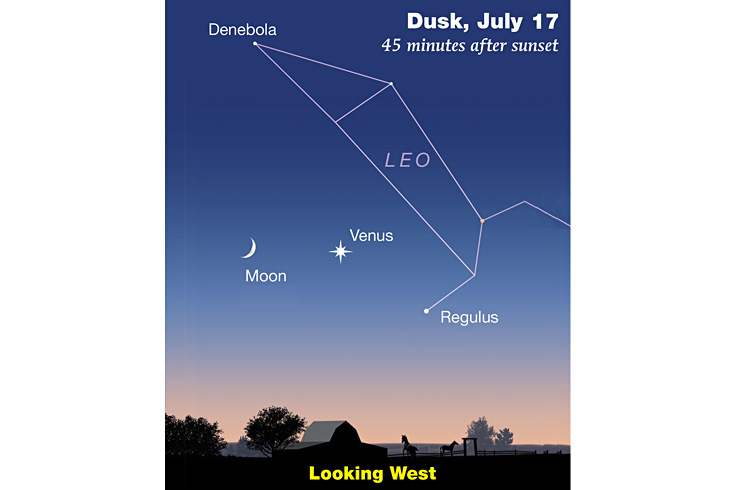
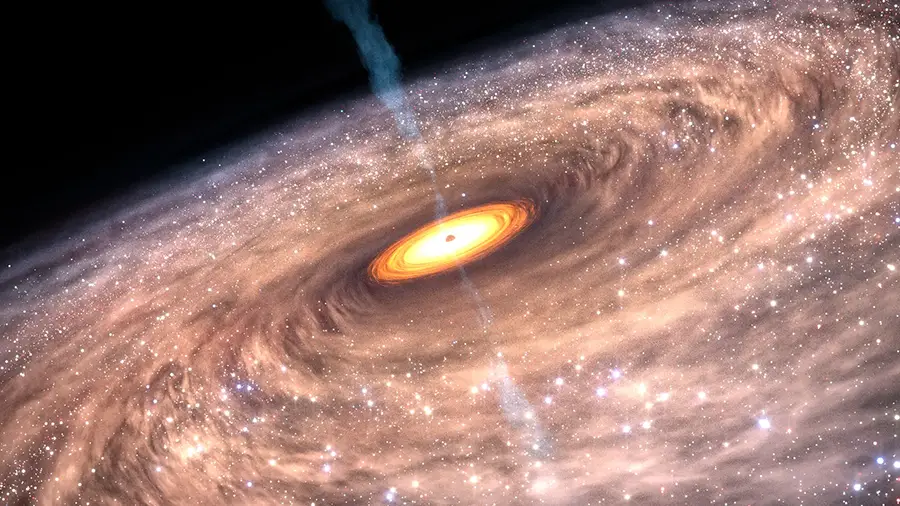
VISIBLE: D. DE MARTIN; INFRARED: NASA / JPL-CALTECH / L. REBULL (SSC / CALTECH)
On January 30, 2020, an era in astronomy will end. On this date, NASA’s Spitzer Space Telescope will send us its final observations, finishing a remarkable,16-year exploration of the universe at infrared wavelengths. Spitzer is one of the four Great Observatories, a quartet of space telescopes launched by NASA in the 1990s and early 2000s to unveil the multiwavelength universe, from infrared to gamma ray. Originally known as the Shuttle Infrared Telescope Facility (SIRTF), the telescope concept came to life in 1971, when NASA was seeking payloads to fly on the Space Shuttle. Converted in 1984 to a free-flying observatory orbiting Earth, SIRTF underwent a series of (sometimes drastic) redefinitions before being launched as a Great Observatory into a heliocentric orbit in August 2003.
Although the public often latches onto Hubble (another Great Observatory) as the pinnacle of scientific discovery machines, astronomers already knew while planning Spitzer that there was at least as much to explore at infrared wavelengths as at visible ones. Infrared radiation pierces our galaxy’s giant molecular clouds to reveal the dusty cocoons of forming stars. It also unveils distant galaxies heavily enshrouded in cosmic dust. Furthermore, because the universe’s expansion stretches the light from distant galaxies to longer wavelengths, it is infrared, not visible light, that enables us to look back in time to the universe’s first few billion years.
Still, back when mission planners were first envisioning what Spitzer would do, no planets were known to orbit stars other than the Sun, and the most distant objects known lay 10 to 11 billion years in the universe’s past. Now, Spitzer has not only seen exoplanets crossing in front of their stars but also directly detected the glow from their heat and the chemical components of their atmospheres. We thought we were being bold in developing science programs to look back billion years, but Spitzer has detected galaxies seen as they were more than 13 billion years ago, just a few hundred million years after the Big Bang. In short, Spitzer has greatly advanced our understanding of the universe.

Gregg Dinderman / S&T; source: NASA / JPL-Caltech
Rechristened
The Shuttle Infrared Telescope Facility’s name changed to Spitzer when the first scientific results were announced in December 2003. The name honors astrophysicist Lyman Spitzer, Jr., who in 1946 was one of the first to propose putting a telescope in space, and who tenaciously lobbied both NASA and Congress for a space telescope’s development.
Cosmic Chill
Spitzer originally observed mid- to far-infrared wavelengths, from 3.6 to 160 microns. For sensitive infrared observations from space, it is necessary to cool the telescope and the detectors to within shouting distance of absolute zero. Previous infrared instruments had launched cold, but the team took a different approach with Spitzer: SIRTF launched with most of the telescope at room temperature, then turned the spacecraft so that its solar panels shielded the telescope from sunlight and let it cool to less than 40 kelvin (−233°C) by radiating its heat into cold space. Radiative cooling is very effective in a heliocentric orbit, far from Earth’s glow; only after this initial cooling did the liquid helium cryogen kick in to take the detectors to less than 2K. After the cryogen supply was exhausted in 2009, radiative cooling enabled Spitzer to continue observing in its two shortest wavelength bands, at 3.6 and 4.5 microns, with no loss of sensitivity. This second phase is known as Spitzer’s warm mission.
The inherent sensitivity of a cryogenic telescope in space, which provides access to the entire infrared spectrum free of the bright emission of the atmosphere or the telescope itself, allows the 33-inch Spitzer to be many times more sensitive than even a 10-m ground-based telescope operating at the same wavelengths. Spitzer’s instruments exploited this gain by filling its focal plane with (what were then) large-format detector arrays. These arrays not only enabled efficient spectroscopy at wavelengths between 5 and 40 microns, but also allowed Spitzer to achieve both deep and rapid imaging surveys over fields of view comparable to or much larger than the angular size of the full Moon. These capabilities gave astronomers a valuable window on the universe, from star formation and exoplanets to the evolution of galaxies over cosmic time.

Terri Dubé / S&T
Formation of Stars and Planetary Systems
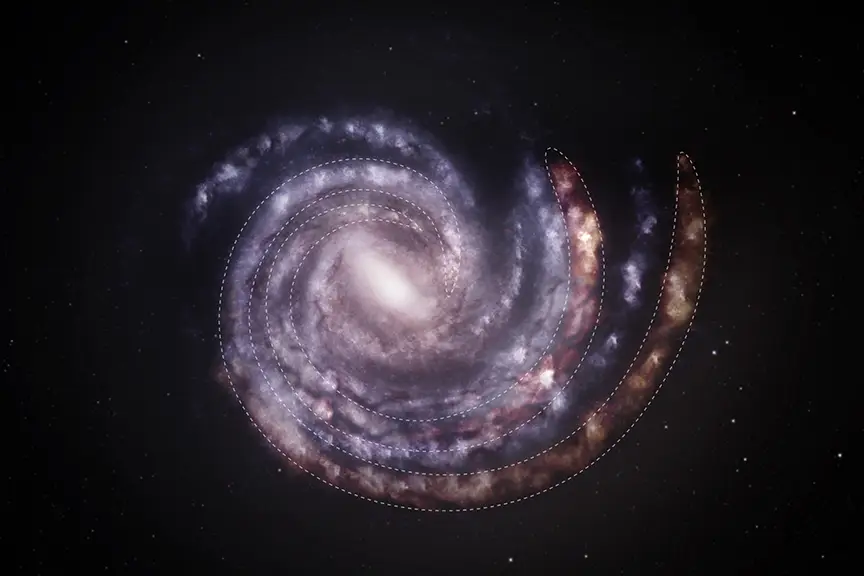
Although our Milky Way Galaxy came together some 13 billion years ago, stars have been forming throughout its history, from its first years through when the Sun and Earth coalesced some 4.6 billion years ago and to today. We now understand that, in most cases, a forming star gives birth to a planetary system.
Infrared observations can peer through dense interstellar dust clouds, which are opaque at visible wavelengths. They can also record the light emitted by objects which are too cold (below a few thousand degrees kelvin) to produce appreciable visible light. Spitzer’s extensive studies of the formation and evolution of stars and planetary systems exploit both these qualities.

Edge-on spectrum: adapted from A. Noriega-Crespo et al. / Astrophysical Journal Supplement Series 2004; Disk: NASA / JPL-Caltech / R. Hurt (SSC / Caltech); Face-on spectrum: Adapted from NASA / JPL-CALTECH / J. S. Carr AND J. R. Najita / Science 2008
Starbirth begins when a portion of a dense interstellar cloud of gas and dust starts to collapse under its own gravity. The forming star passes through a number of stages, each of which has a characteristic appearance in the infrared, driven initially by the energy released by the infalling material and later by the onset of nuclear fusion. Even as the core bulks up and develops into a star, conservation of angular momentum dictates that some of the collapsing cloud forms a protoplanetary disk orbiting the star.
Spitzer’s surveys have measured hundreds to thousands of young stars in each of these stages. Those observations have shown that the coagulation process that results in planets begins within a few million years of the disks’ formation. Spitzer has also seen the very stuff that life as we know it depends on being absorbed into forming planetary systems. Spectra of face-on protoplanetary disks show us warm gas rich in water vapor within the central few astronomical units around the protostar. At the same time, looking edge-on through a cold disk we see absorption due to silicate dust, as well as the telltale signatures of frozen water and other ices that have condensed on the cold surfaces of the silicate grains. These icy grains might one day participate in the formation of habitable worlds.

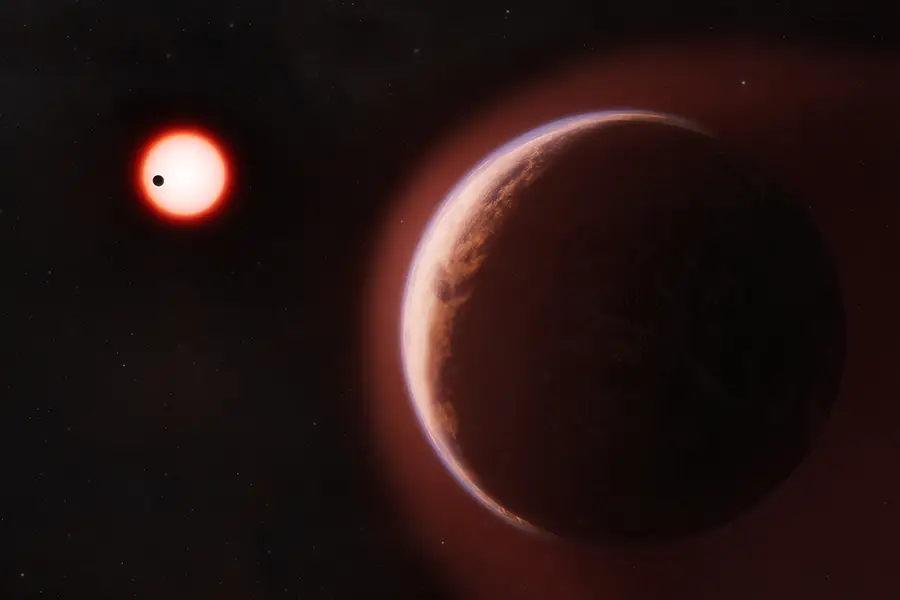
NASA / JPL-Caltech
Exoplanets
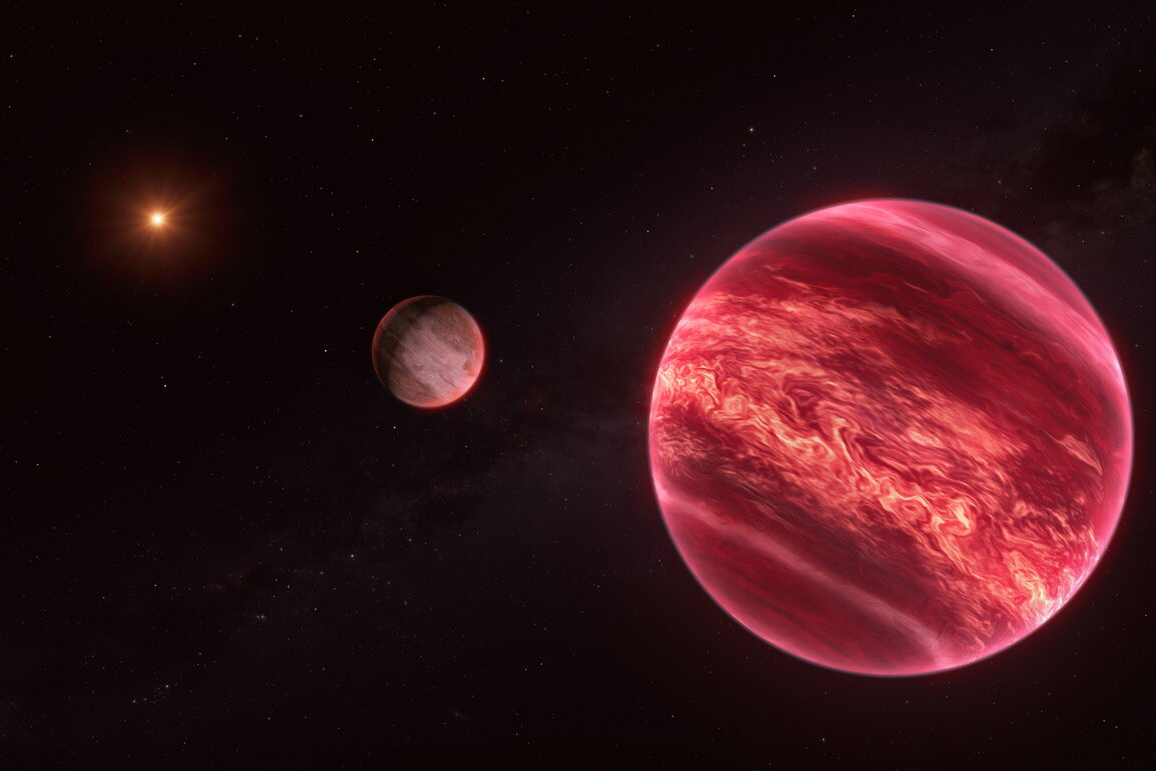
The study of exoplanets is one of the most exciting areas of contemporary astrophysical research. Astronomers have detected only a few dozen exoplanets directly, because it is very difficult to see the light from a planet in the glare of the nearby host star. But exoplanets are so common that many lie in orbits seen edge on, passing first in front of, then behind their stars from our perspective. This geometry gives Spitzer multiple ways to learn about alien worlds.
One of the most famous examples of this work is the Trappist-1 planetary system. Following up on ground-based observations that hinted at a peculiar system, a 20-day Spitzer campaign caught seven Earth-size planets transiting across the face of the faint red star Trappist-1 in 2016. Three of these exoplanets may lie in the star’s habitable zone, where liquid water could exist stably on their surfaces.
Spitzer’s precise timing of these worlds’ transits enabled astronomers to determine that gravitational tugs exchanged by the planets changed the exact moment when each planet crossed in front of the star. The altered transit times in turn revealed the exoplanets’ masses. As the planets’ radii are known from how much starlight they block as they transit, we thus also know the worlds’ densities. This makes Trappist-1 perhaps the best characterized planetary system outside of the solar system.
Astronomers can also use Spitzer to study planets’ heat signatures. If a planet glows brightly enough in the infrared, then when it passes behind its star Spitzer will detect a tiny drop in the system’s emission, because the light of the planet is no longer seen. The depth of this eclipse tells us how much infrared radiation the planet emits. When combined with the planet’s size, this measurement indicates the planet’s temperature. Spitzer has measured planets as hot as 3000K and as cool as 700K, but it cannot reach down to Earth’s temperature, which is about 300K.
Transiting systems can also tell us about exoplanet atmospheres. Spitzer’s measurements can be combined with observations at shorter wavelengths to study the composition of an exoplanet’s atmosphere and even to diagnose the presence of clouds or hazes. Spitzer eclipse measurements in five infrared bands between 3.6 and 16 microns show that the exoplanet GJ 436b, for example, has a much higher fraction of heavy elements in its gaseous atmosphere than does its host star. GJ 436b is about the size of Neptune, which, interestingly, shows a similar enhancement in heavy elements relative to the Sun.

Gregg Dinderman and Leah Tiscione / S&T; source: NASA / JPL-Caltech / Univ. OF Cambridge and NASA / L. Kreidberg (Center for Astrophysics, Harvard & Smithsonian)
In addition, we can study another aspect of a planet’s atmosphere by observing the change in its brightness throughout its orbit as it shows us different fractions of its starlit side. This pattern, called a phase curve, shows how well the atmosphere redistributes the energy of absorbed starlight. When astronomers converted Spitzer’s phase curve into a map of the temperature distribution for the Jovian-mass exoplanet HD 189733b, the map showed that the hottest spot on this exoplanet is not at the point where the star is directly overhead. Rather, the hotspot is displaced by about 30 degrees in longitude, likely due to winds of thousands of miles per hour transporting energy before it can be radiated away. Spitzer has seen similar offsets on other planets, including 55 Cancri e. In the case of the recently discovered super-Earth LHS 3844b, by contrast, the absence of such an offset, combined with the drastic drop in temperature from the dayside to the nightside, shows that this exoplanet has at most a very thin atmosphere. Although many telescopes have measured transits, Spitzer has stood almost alone in its ability to measure eclipses and phase curves.
The discussion above illustrates how scientists have used Spitzer and other telescopes to derive remarkably detailed information about exoplanets, even though they’re never directly seen. The architectures of these systems differ from that of our own solar system. Indeed, if our familiar eight planets orbited a nearby star at the same distance they orbit the Sun, they would have gone undetected by most of the techniques used to date.
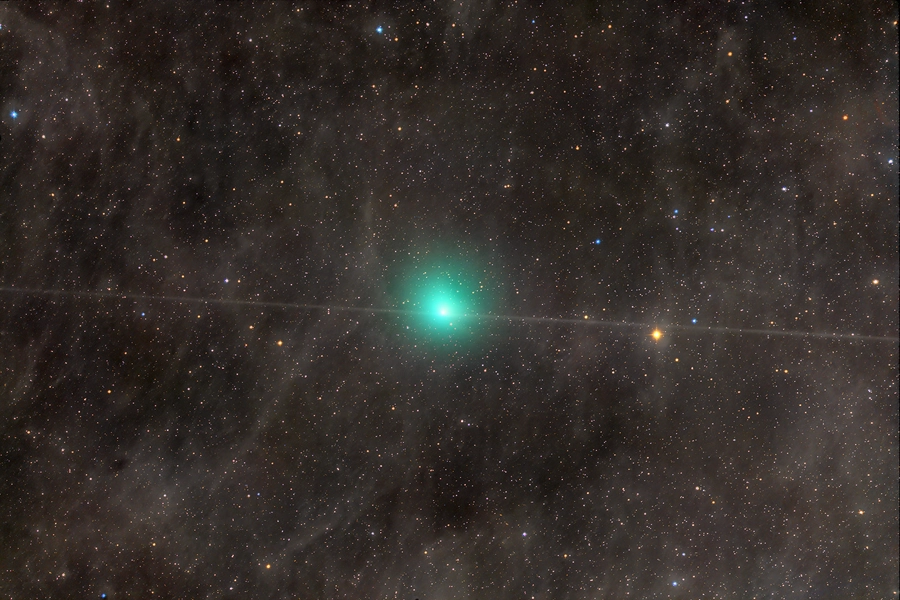
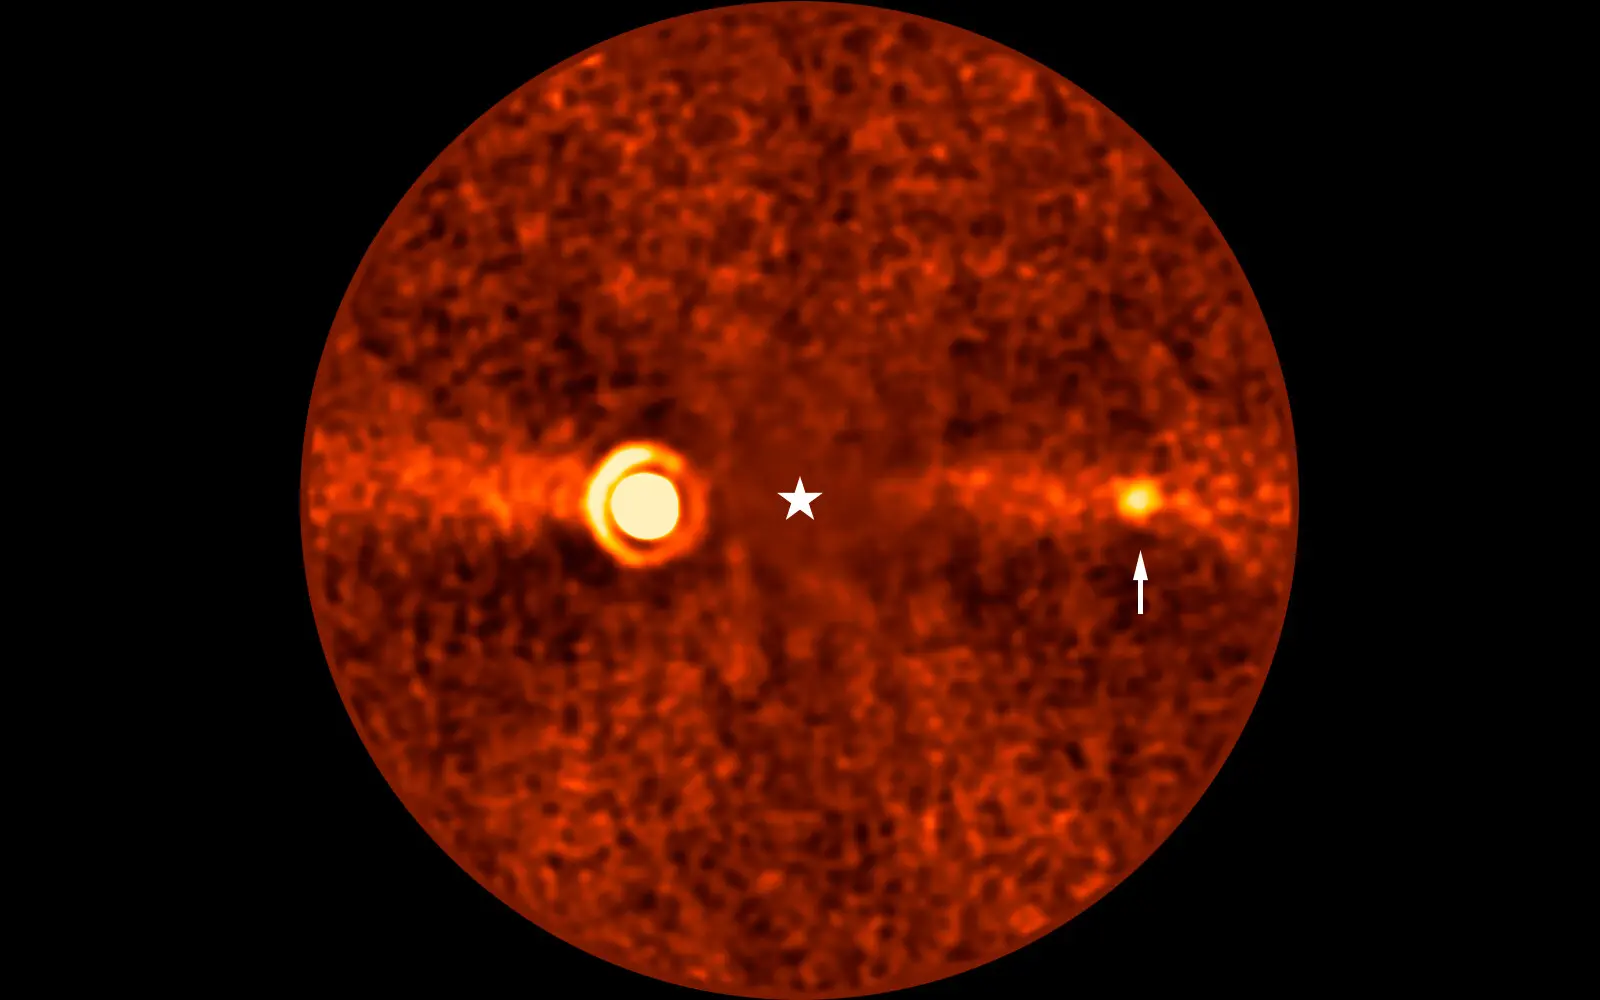
Nevertheless, there are remarkable similarities between our own solar system and exoplanetary systems. Systems with multiple planets are common. The silicate materials found often resemble those seen in comets, such as Hale-Bopp and Tempel 1. Many systems show evidence for two bands of circumstellar dust, corresponding roughly to the zodiacal dust in the inner solar system and the Kuiper Belt farther out. In at least one case, four giant planets orbit in the region between these two belts, just as Jupiter, Saturn, Uranus, and Neptune lie between the two solar system belts. Finally, collisions between 100 km-size asteroids in systems, inferred from transient increases in the dust orbiting the stars, are counterparts to the violent events that shaped our system’s inner planets.
Thus, the evolution of the universe has led in many cases to conditions similar to those in our own system, including conditions that might be favorable to the development of life.
The Distant Universe

NASA / JPL-Caltech
Spitzer has also observed beyond the stars and exoplanets of our own galaxy, reaching out to the billions upon billions of galaxies in the universe. Understanding how galaxies form and evolve has been a driving question in astrophysics for many decades. Infrared observations have been applied to this question in two separate domains: low and high redshifts. These domains split at a redshift of 3, corresponding to a lookback time of approximately 11.5 billion years.
With its enormous gain over prior missions in imaging sensitivity, predominantly at 24 microns, and its substantial spectroscopic capability, Spitzer has probed infrared-bright galaxies throughout the universe’s last 11.5 billion years. For these galaxies, any infrared emission at wavelengths longer than 5 microns is generally the warm glow from dust heated by young stars. This radiation is a proxy for the number of young stars, and from this glow we can determine the star-formation rate. Combined with multiwavelength data from other instruments, these results show that star formation across the universe peaked between 2.3 and 3.8 billion years after the Big Bang and has been decreasing ever since. Astronomers refer to this period of rampant starbirth as cosmic high noon.

NASA / ESA / Hubble Heritage Team (STSCI / AURA)
Swathed in dust, many of the distant galaxies we see are faint at visible wavelengths, even though they blaze in the infrared. As we look back in time, the concentration of galaxies that are oddly bright in the infrared skyrockets. These systems appear to be predominantly powered by vigorous star formation, with hundreds to thousands of solar masses of gas being converted each year into stars. The starbursts are almost entirely obscured by dust. Thus, the most active period of star formation in the universe is largely hidden from view in visible light and accessible only with infrared observations.
For far more distant galaxies, those with a redshift of 6 or greater (or a lookback time of 12.5 billion years or more), the galaxy’s light has been stretched so much that the glow from star-heated dust is undetectable by Spitzer. For a galaxy at redshift 6, an observed wavelength of 4.5 microns corresponds to an emitted wavelength of 0.64 micron, which lies at the red edge of the visual band. Thus for high redshifts, Spitzer tells us not about the thermal emission from galaxies but about the visible light they emit.
This visible light comes from the galaxies’ older stars. Because these older stars dominate a galaxy’s stellar population, we can use their light to measure the total mass of stars in the galaxy.
Astronomers can also compare Spitzer observations to those by Hubble or ground-based instruments to extract the age of the stars producing the ultraviolet and visible light that’s been redshifted to Spitzer’s domain by cosmic expansion. Observations of one such galaxy, at a redshift of 9.11, indicate the stars are approximately 300 million years old. Since the galaxy is observed at a lookback time of 13.2 billion years, the result suggests that this galaxy’s star-formation episode occurred about 300 million years after the Big Bang.
These observations enable Spitzer to measure the growth of galaxies in two ways: by measuring how much mass is in galaxies at a given time, and by measuring how fast the galaxies are growing by forming stars. Comparing what we’d expect the stellar masses to be, based on the starbirth rates, with what we actually observe yields a gratifying confluence across more than 12 billion years of cosmic history. The strong agreement demonstrates that with Spitzer, Hubble, and large ground-based telescopes, we are indeed developing an accurate picture of the growth and evolution of galaxies in the universe.
Reaching into the Past
The basic tool used to discover galaxies with high redshifts is the Lyman dropout technique (S&T: Apr. 2018, p. 14). This method utilizes the fact that neutral hydrogen atoms become ionized when they absorb photons with wavelengths shorter than 0.09 micron. So the universe, which is suffused with neutral hydrogen gas, is effectively opaque to such photons. Thus, if an image obtained at 0.5 micron shows a galaxy that is not seen at 0.4 micron, we infer that the redshifted wavelength of hydrogen ionization falls between the two bands, at about 0.45 micron. From there, we can calculate that the galaxy has a redshift of approximately 4.

NASA / JPL-Caltech / ESA / Spitzer / P. Oesch / S. De Barros/ I. Labbe
Infrared Leaps
This wide-ranging scope of discovery is now coming to an end. Faced with a limited pool of funds, NASA has chosen to retire Spitzer because the high operating cost inherent to its mission design made it less attractive than other operating missions that were competing for the same funds.

P. Madau AND M. Dickinson / Annual Review of Astronomy & Astrophysics 2014
Because Spitzer was such a leap in capability compared to what had come before, it was able to lead the way in astrophysical exploration over the last decade and a half. This is the constant lesson of advances in technology that have driven astrophysics since the end of World War II. We saw this with the early infrared missions, with space observatories, with the twin Keck telescopes, and with the Very Large Telescope quartet in Chile, as well as with myriad other instruments, all of which, in one way or another, have probed the mysteries of the infrared universe. Doubtless we will continue to see it with future ground- and space-based telescopes, including the next major infrared facility, the James Webb Space Telescope, set to launch in 2021.
Even as Spitzer sends its final data back to Earth at the end of January 2020, commands will be sent to place the spacecraft into a safe orientation and shut it down, leaving it to drift silently in an Earth trailing orbit. As we bid it goodbye, we eagerly anticipate seeing the wonders of the universe unveiled by Spitzer further explored by future telescopes.

NASA / JPL-Caltech
The Farthest Galaxy Spitzer Can See
Spitzer’s redshift limit is currently set by the heroic observation by Pascal Oesch (now University of Geneva) and his colleagues of a galaxy at a redshift 11.1. The detection required about 70 hours of Spitzer observations at 4.5 microns. We see this galaxy at a time when the universe was only 3% of its current age.
FURTHER READING:
A more complete account of Spitzer science is given by Werner and Peter Eisenhardt in More Things in the Heavens: How Infrared Astronomy is Expanding Our View of the Universe. Princeton University Press, 2019 (see book review on page 57).
This article first appeared in the January 2020 issue of Sky & Telescope with the title "Spitzer's Legacy."


Comments
Lou
February 7, 2020 at 5:51 pm
I have to say that my favorite Spitzer discovery is that stars are actually shaped like triangles! 😉
You must be logged in to post a comment.
You must be logged in to post a comment.