 0
0Astronomers have mapped Orion in 3D to understand the origin of the large arc of Barnard’s Loop — and you can interact with the 3D image!
Stellar nurseries and the gas around them have long been studied in two dimensions. While these plane-of-sky studies yield plenty of information, not knowing the 3D picture limits our understanding of how these regions give birth to stars.
Recently, a team led by led by Michael Foley (Center for Astrophysics, Harvard & Smithsonian) applied a novel 3D-mapping technique to a structure within the Orion star-forming complex. Foley presented the findings last week at the 240th meeting of the American Astronomical Society, held in Pasadena, California. (A preprint of the results is available here.)
Barnard's Loop
The Orion Molecular Cloud Complex is the closest site of ongoing massive star formation, at a distance of about 1,500 light-years. This clustering of nebulae and young stars is huge, engulfing much of the constellation.
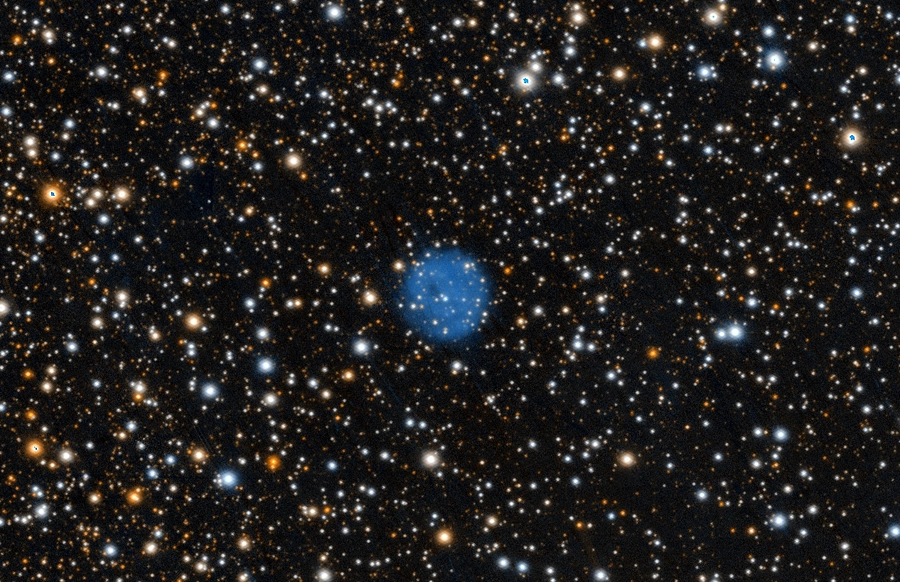
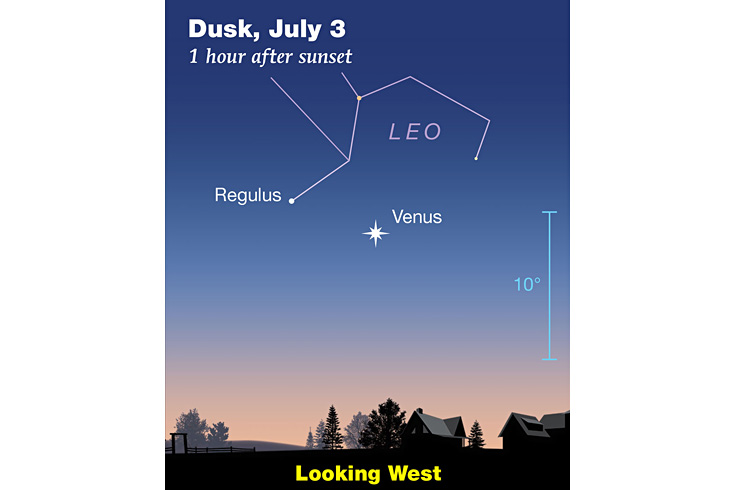
Most everyone is familiar with the famed Orion Nebula (M42), and other features such as the Lambda Orionis ring, a molecular cloud and H II region, are also pretty well known. But there’s another structure associated with the Orion Complex that's of interest: Barnard’s Loop. This arc of hot gas is huge on the sky — it extends across roughly 14°, corresponding to around 370 light-years at its distance.
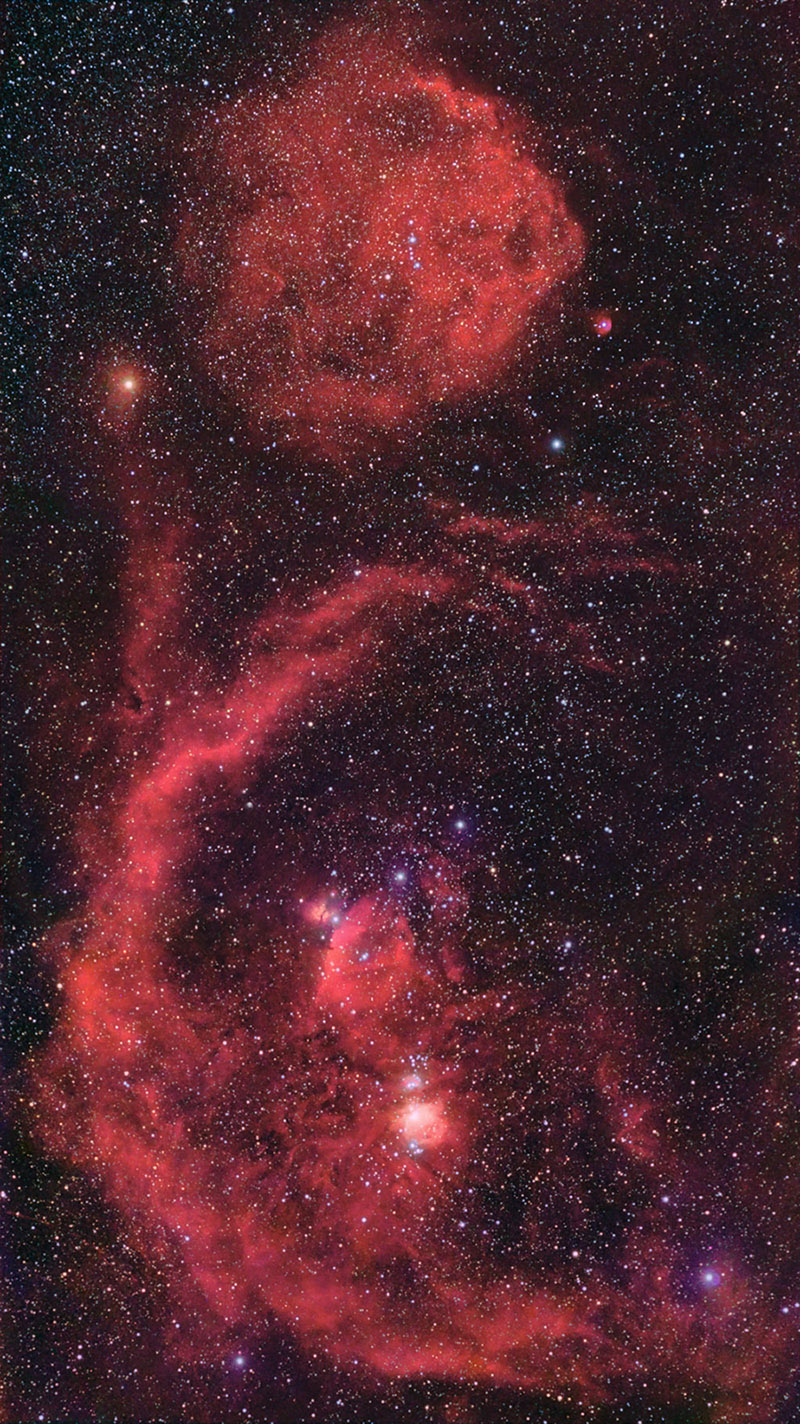
Sean Walker
Researchers have long debated (for more than a hundred years, in fact!) the origin of Barnard’s Loop. Now, Foley and his team think they know how it formed. Using 3D data, they’ve traced the loop's origin back to supernovae that took place within the last 4 million years or so.
Specifically, they’ve identified an expanding star cluster named OBP-B1 as the likely source of the stars that exploded as supernovae. The cluster lies near the centers of both Barnard’s Loop and a giant dust cavity. The long-ago supernovae would have swept up any intervening dust, clearing out the cavity.
Several other molecular clouds, including Orion A and B and the one associated with Lambda Orionis, line the edge of this cavity. Their alignment suggests that most of the star formation in the Orion Complex occurs at the cavity's edge, triggered by supernovae's pressure waves.
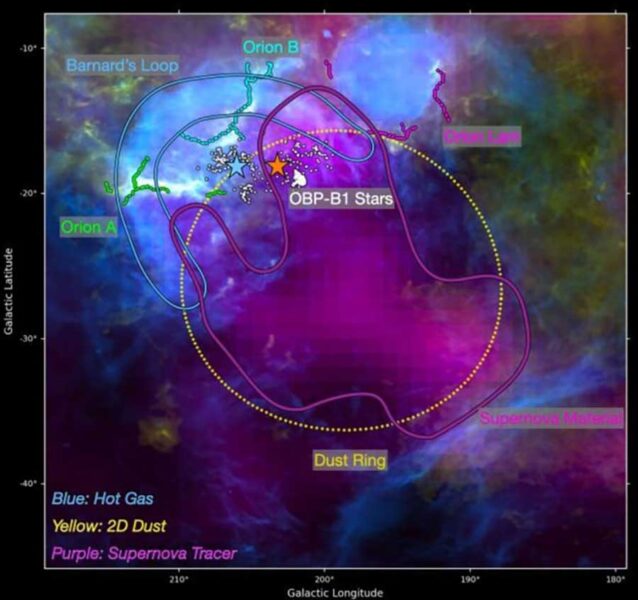
Michael Foley
How to Map in 3D
While 2D data has long existed in the form of, for example, the distribution of dust on the sky, the third dimension comes from more recent data released by the European Space Agency's Gaia mission, including stars' 3D positions and velocities.
“Our first large-scale 3D look at Orion tells us so much,” says Foley. “Prior to this work, most studies of Orion were confined to two dimensions — up-down and left-right on the sky.” Now, the team can find connections between the huge cavities of gas and dust and the clusters of stars.
Find — and play with — the 3D interactive map of the Orion Complex here.
You can interact with the 3D map of the Orion Complex here. (You may need to use the bar to scroll to the right and access the legend. View the interactive website here.)
The team has done this before for, among other targets, the Perseus-Taurus Supershell. The new results corroborate their previous findings — that supernovae carve cavities out of the interstellar medium and in turn trigger star formation at the cavities' outskirts. In other words, when massive stars end their lives in cataclysmic events, they create the ideal conditions for the formation of new stars.
“It seems clear that we are going to see a ‘Swiss cheese’ picture of the interstellar medium, with stars forming at the edges of the holes, as we map more and more of the galaxy,” says team member Alyssa Goodman (Center for Astrophysics, Harvard & Smithsonian).
To generate the interactive 3D diagrams, the team used the open-source Glue software, created and funded by NASA in part to visualize James Webb Space Telescope data. Goodman is Glue's principal investigator, while another coauthor, Catherine Zucker (Space Telescope Science Institute) wrote a plug-in for the software that exports the 3D figures into a format that can be used with any browser (as in the link above).
Glue software is now expanding into other areas of science as well, and Goodman’s hope for the future is that “soon all scientists will explore their ‘universes’ in 3D.”
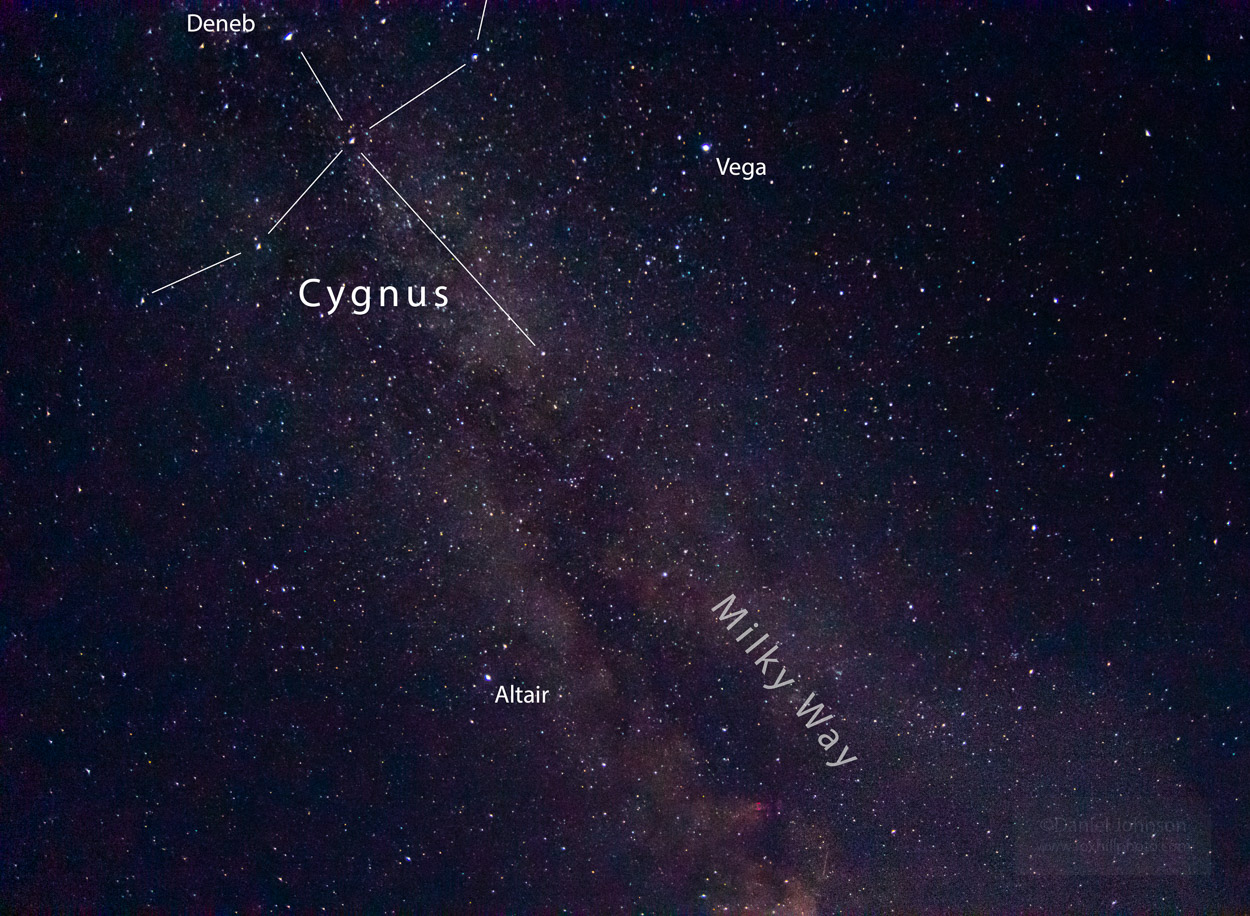
The story doesn’t end here: The team will now turn their attention to other similar regions in the Milky Way.
About Diana Hannikainen
Diana, a professional astronomer in her past life, is delighted to be a member of the Sky & Telescope staff and is thrilled to reconnect with the visual night sky.


Comments
You must be logged in to post a comment.