 0
0New observations reveal turbulent flows in the supernova remnant Cassiopeia A and in the solar corona.
Pre-Supernova Shake-up
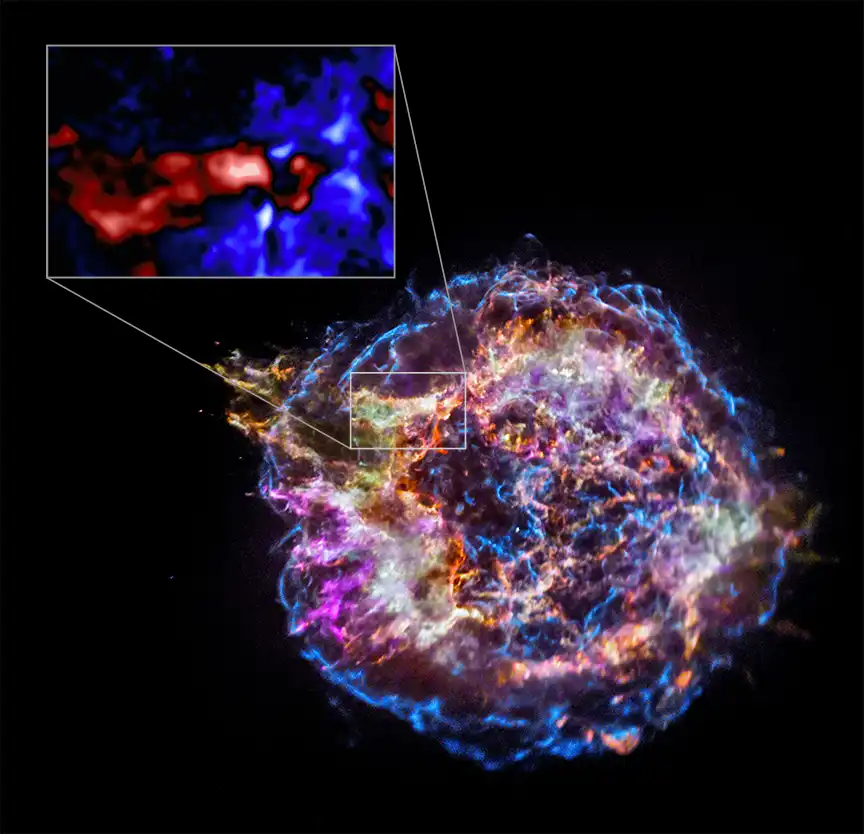
X-ray: NASA/CXC/Meiji Univ./T. Sato et al.; Image Processing: NASA / CXC / SAO / N. Wolk
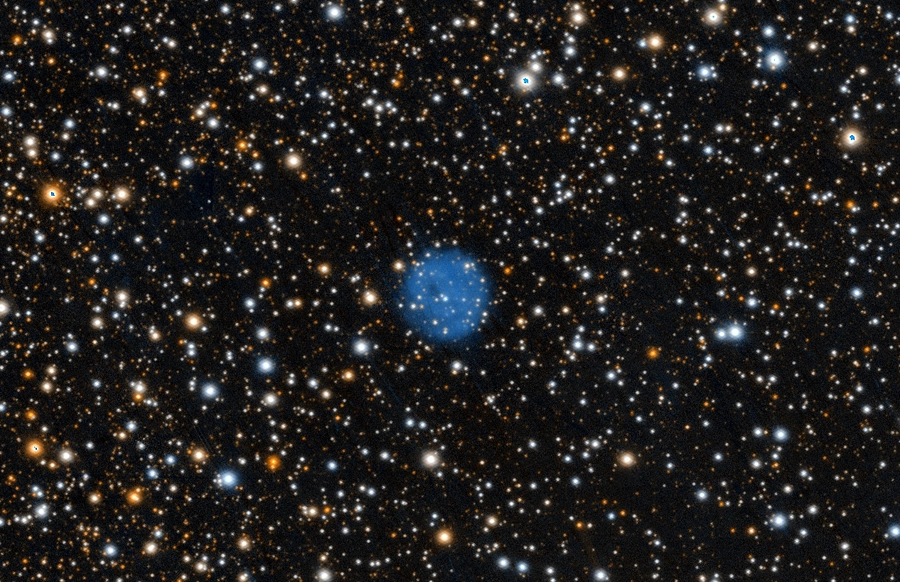
Just before a massive star exploded— shedding a wreath of gas that we now call Cassiopeia A — violent boiling mixed up the star’s ordered insides. New images from the Chandra X-ray Observatory have revealed echoes of that shake-up.
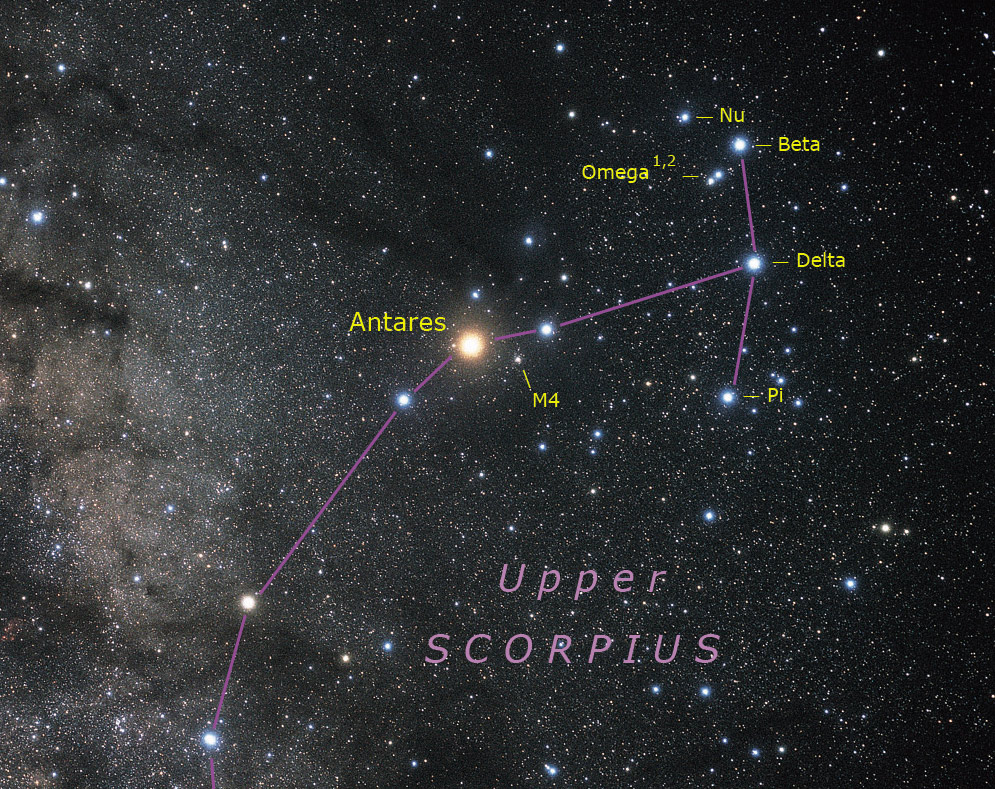
Cassiopeia A, 11,000 light-years away in the constellation of the same name, marks the gaseous remains of a core-collapse supernova that occurred more than 300 years ago. Shortly after Chandra’s launch in 1999, it took in the gauzy veils that mark this remnant — and, for the first time, revealed the dot of X-ray emission coming from the neutron star in the remnant’s heart. Now, 25 years later, Chandra observations have revealed the turbulent motions that occurred just outside the collapsing core.
All their lives, stars fight gravity with nuclear fusion, first merging hydrogen atoms into helium, then, when hydrogen runs out, fusing heavier and heavier elements. Eventually, the core is a ball of iron, wrapped in onion-like layers of elements that become lighter and lighter toward the surface. (New observations of supernova SN 2021yfj recently revealed firm evidence for this orderly arrangement.) When the core collapses into a neutron star, many of those outer layers are thrown off like a sweater discarded on a hot summer day.
But in Cassiopeia A, Toshiki Sato (Meiji University, Japan) and colleagues find a mishmash of elements that indicate a different story, publishing results in a study that will appear in the Astrophysical Journal. Mere hours before the star exploded, an oxygen-fusing shell deep in the interior suddenly swallowed up the carbon- and neon-rich shell just outside it. Neon fused suddenly as it fell inward while silicon-rich gas flowed outward as the two shells became one. Those flows are still visible in the Cassiopeia A remnant (see inset in the image above).
The asymmetry generated by those turbulent flows isn’t just about aesthetics — it actually helped power the shock wave that was passing through the star’s outer layers as they suddenly expanded. The progenitor star lived for millions of years; the image sheds light on its final hours.
Read more in Chandra's press release and in the paper, posted on the astronomy arXiv preprint server.
New Views of the Closest Star
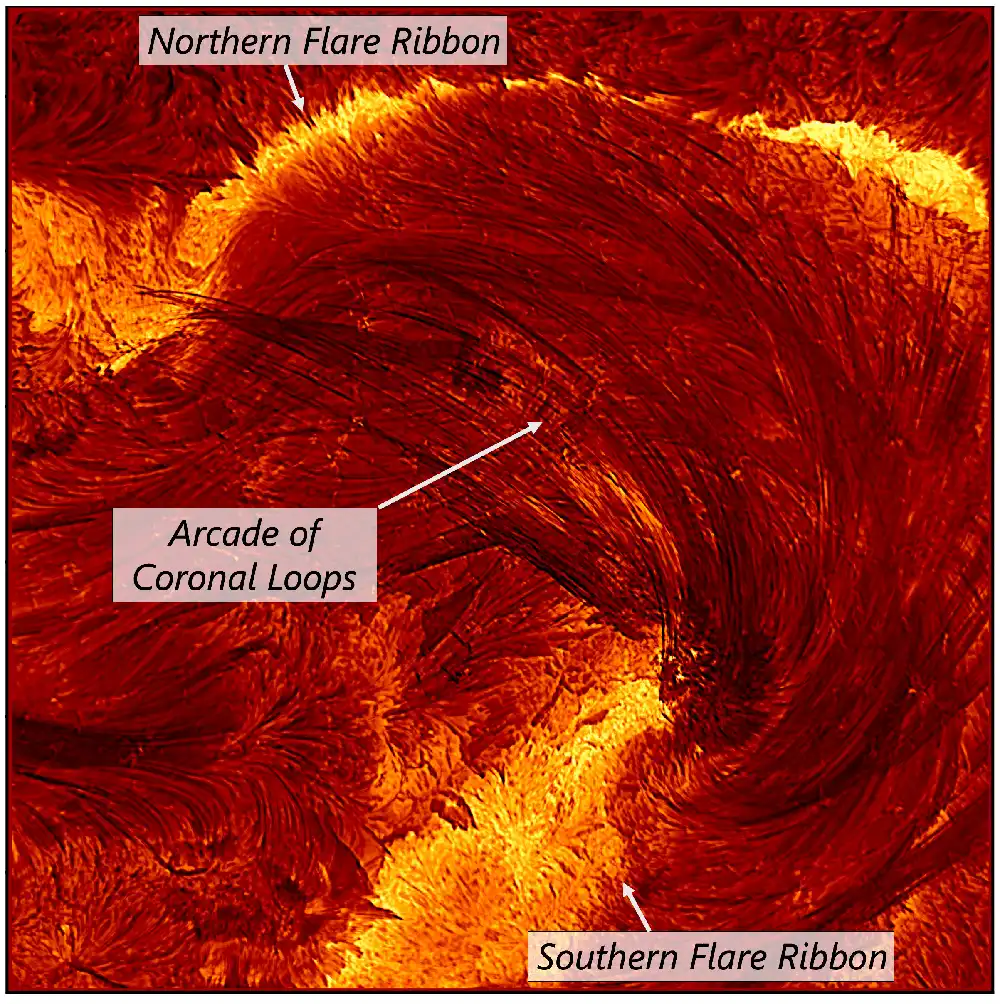
NSF / NSO / AURA
The Daniel K. Inouye Solar Telescope caught its first X-class flare on August 8, 2024. In doing so, the sharp-eyed telescope captured fine details in the gases that swirl along magnetic loops in the Sun's extended atmosphere, or corona. Imaging hydrogen-alpha emission at a wavelength of 656.28 nanometers, Inouye found individual streams of gas that are on average only 48 km (30 miles) wide, with some spanning just 21 km — about the length of Manhattan.
These are the smallest coronal loops ever imaged, and will help scientists study the physics of the magnetic plasma that swirls around the Sun. The magnetic fields that those gas flows outline are packed like sardines — so closely that a sudden rearrangement of those fields, known as magnetic reconnection, can pack a powerful punch, visible as a flare of high-energy radiation.
“We’re finally peering into the spatial scales we’ve been speculating about for years,” says Cole Tamburri (National Solar Observatory), who led a study to appear in Astrophysical Journal Letters. “This opens the door to studying not just [the coronal loops'] size, but their shapes, their evolution, and even the scales where magnetic reconnection — the engine behind flares — occurs.”
The National Solar Observatory shared a short video version of this view from their X (formerly Twitter) account that reveals the complexity of the flows involved. Note that the video is sped up by a factor of 100; the gas is moving much more slowly than shown here.
Read more in the National Solar Observatory press release and in the paper.
About Monica Young
Monica Young, a professional astronomer by training, is News Editor of Sky & Telescope.


Comments
You must be logged in to post a comment.