 3
3Astronomers will use the newest data release from the Gaia mission to explore stellar tsunamis, Milky Way history, and more.
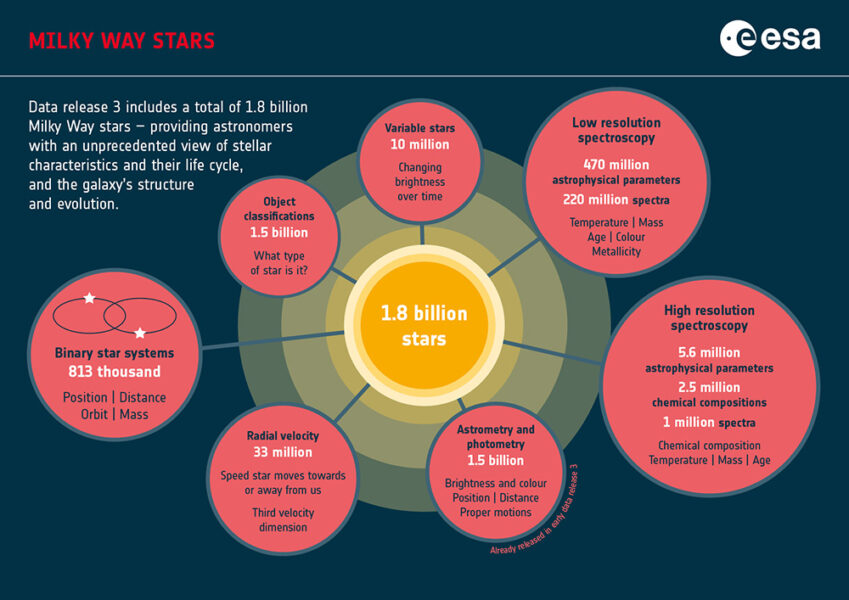
Today, the European Space Agency’s Gaia mission releases its third data set, with new and improved details on 1.8 billion stars in the Milky Way and beyond.
“[This] day has been anticipated by the entire astronomical community,” says Ricardo Schiavon (Liverpool John Moores University), who uses Gaia data but isn’t involved in the collaboration. “I, for instance, woke up way too early and could not go back to sleep thinking about it!”
For the first time, the new data release includes millions of spectra, showing objects’ brightness across the colors of the rainbow. These rainbows reveal Milky Way stars’ motions toward and away from Earth, their radial velocities, which when combined with other Gaia data, gives their 3D motion through space. Spectra also uncover stars’ make-up and even their origin.
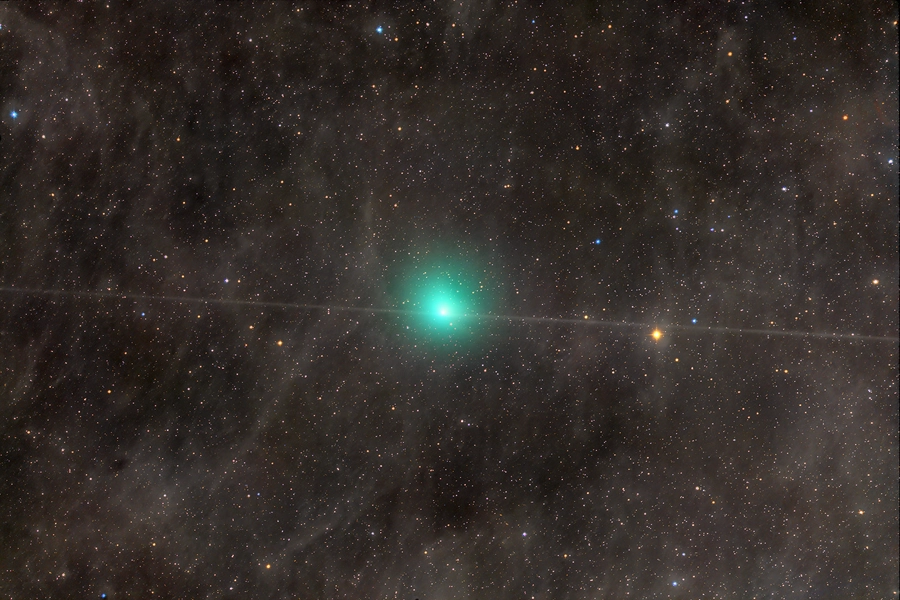
The release also contains brand-new information on 1.2 million more distant stars in the Andromeda Galaxy, millions of galaxies and quasars, as well as thousands of objects in our cosmic backyard, including solar system moons, asteroids, and comets. The newest data release is accompanied by a series of studies appearing in a special issue of Astronomy & Astrophysics.
A Stellar Revolution
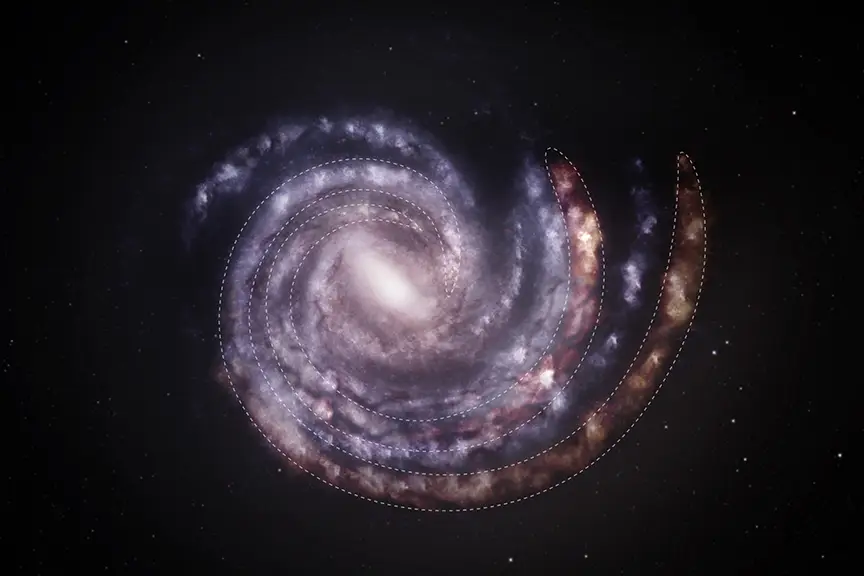
In the decade since Gaia’s launch in 2013, the mission has altered the astronomical playing field. Astronomers have used Gaia data to make unprecedented maps of the Milky Way and peel back 10 billion years of its history.
Even the first data set, released in 2016, gave exquisitely precise brightness and position measurements for more than 1 billion stars. And the data have only gotten better with time.
The space-based telescope spins to take in the whole sky not just once but many times, so that it can watch a multitude of stars as it circles the Sun. (The spacecraft orbits at the L2 Lagrange point, 1.5 million km from Earth opposite the Sun.) The stars’ apparent motion, called parallax, is akin to watching closer objects appear to move when you look at them with first one eye and then the other. To fulfill the mission’s primary science goal, Gaia’s parallax measurements must be unparalleled — precise to within a milliarcsecond for even the faintest stars, and 100 times better than that for the brighter ones.
With a touch of geometry, Gaia’s parallaxes convert into reliable distances for stars throughout the Milky Way. Over time, astronomers have pinpointed more than 1 billion stars not just on the sky, but in space.
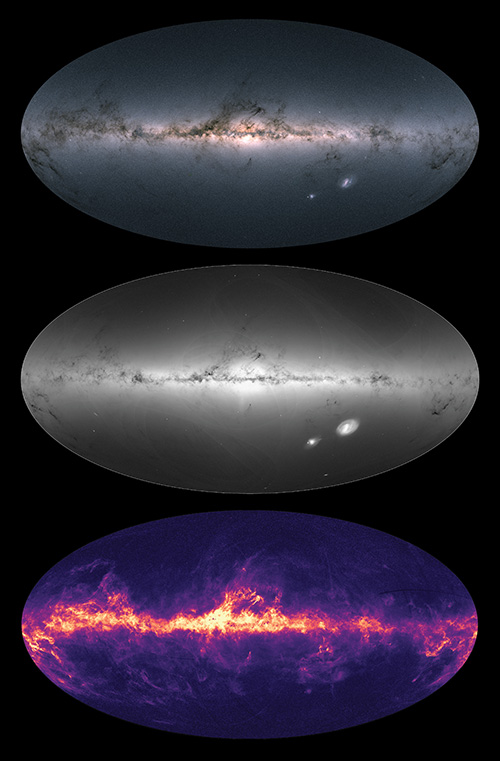
ESA / Gaia / DPAC; Maps: CC BY-SA 3.0 IGO
Years of data collection also reveal stars’ actual movements across the sky. These proper motions, combined with the radial velocities measured from spectra, give stars’ 3D velocity in space. The newest data release contains 3D positions and proper motions for almost 1.5 billion stars; the full six-dimensional data (3D position plus 3D velocity) are available for a subset of 882 million stars. With this information, astronomers can tell apart the groups of stars that orbit in our galaxy.
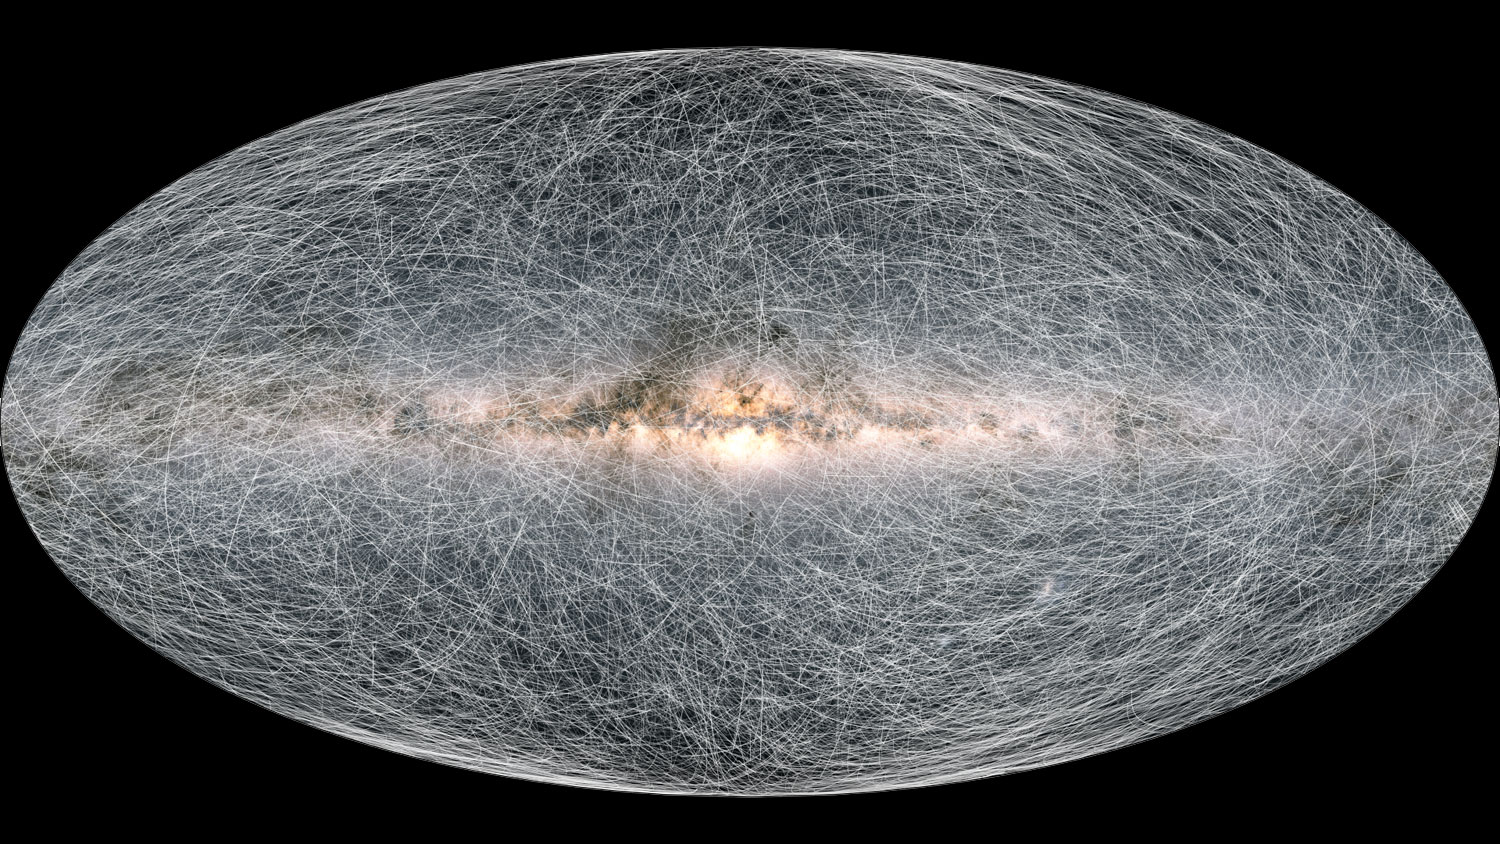
ESA / Gaia / DPAC / CC BY-SA 3.0 IGO; Acknowledgement: A. Brown, S. Jordan, T. Roegiers, X. Luri, E. Masana, T. Prusti and A. Moitinho
Origins from Chemistry
Most anticipated in this release are the spectra, obtained for a subset of 33.8 million stars, constituting the largest ever low-resolution spectroscopic survey. These chemical fingerprints reveal a star’s key characteristics, including temperature, mass, and rotation.
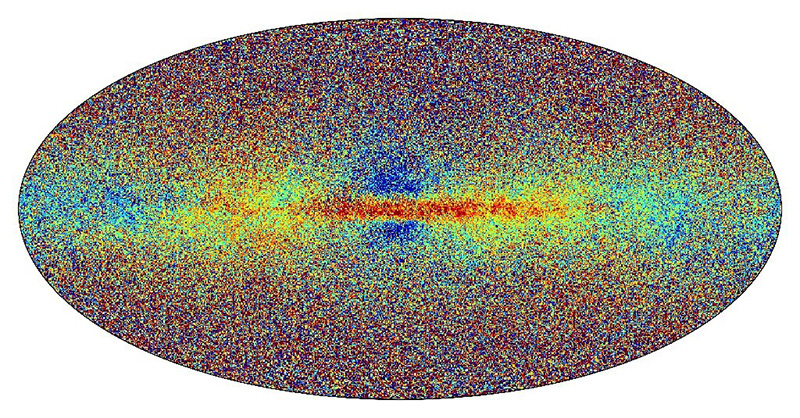
Even higher resolution spectra for a tenth of these stars can even tell us what they’re made of. While stars are primarily hydrogen and helium, they possess trace amounts of heavier elements, forged in the bellies of the stars that came before them. The heavy elements in a star divulge its age and origin.
Gaia has demonstrated that stars nearer the galactic center as well as those nearer the central galactic plane tend to be of later generations, while stars in the halo are more likely to be ancient, born in the universe’s first couple billion years. That much is unsurprising: Where there are more stars, they are more likely to be evolved.
But sometimes, groups of stars have a chemical fingerprint quite unlike their neighbors; these are thought to come from smaller galaxies swallowed by the Milky Way. Astronomers can use such groupings to stitch together our galaxy’s collision history.
Danny Horta-Darrington (Liverpool John Moores University) / ESA / Gaia / SDSS
Previous investigations into this history have come about by combining Gaia data with spectroscopic surveys, such as those undertaken as part of the Sloan Digital Sky Survey. Now, with its own spectral measurements of Milky Way stars, researchers such as Schiavon will even more precisely map the Milky Way.
“My immediate interest in these data is in taking a deep look into the makeup of the galactic halo and thick disk,” Schiavon says. The chemistry and orbits of these ancient and further-out stars will shed light on how the Milky Way first came together.
The Gaia team has also already used the newly collected spectra to offer compositions of solar system asteroids, in addition to their orbits determined from position data.
Strange Stars
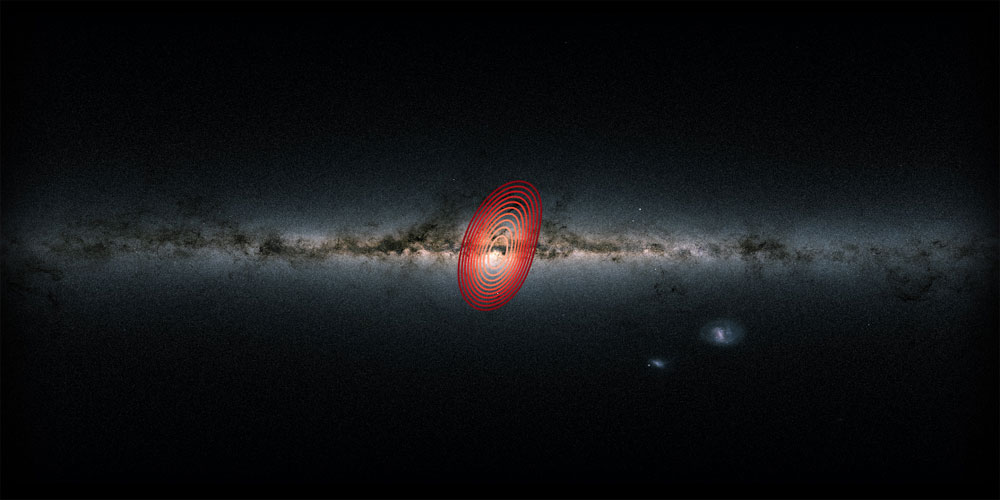
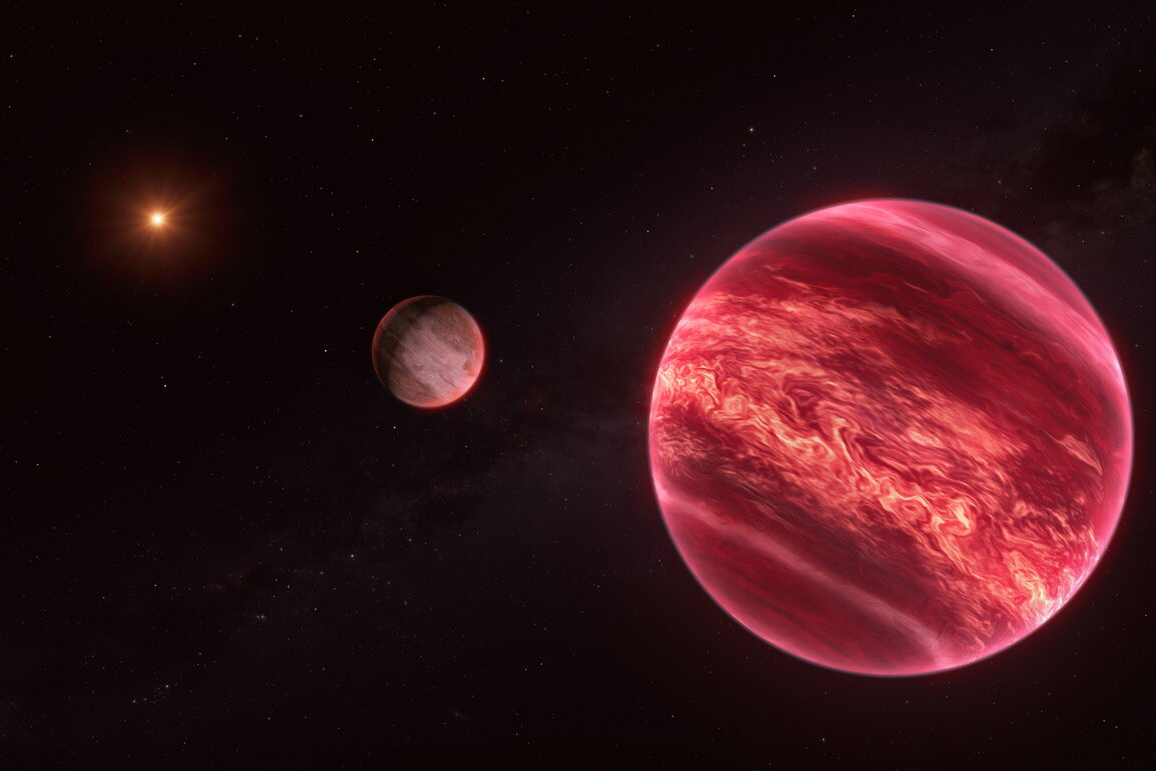
Gaia’s multiple measurements can show stars’ brightness changing over time, generally arising from a change in shape. Often, such changes are symmetric in a way that indicate stars are “breathing” in and out in response to changes in their interior. Occasionally, one-time changes, caused by instabilities, can sweep like a tsunami across the boiling stellar surface.
ESA / Gaia
Gaia has now spotted thousands such tsunamis, or starquakes — including on stars that current theory says shouldn’t have them. Gaia collaboration member Conny Aerts (KU Leuven, Belgium) is among those who want to understand why. “Starquakes teach us a lot about stars, notably their internal workings,” Aerts says. “Gaia is opening a goldmine for ‘asteroseismology' of massive stars.”
Because the Gaia team is carefully processing and analyzing the data, the newest release includes years-old observations, taken between July 2014 and May 2017.That’s half again the timeframe covered by the second data release. Gaia is expected to release another incremental dataset before publishing the full analysis of all the space telescope has collected.
Meanwhile, the spacecraft is still observing, image processing continues, and each new data release becomes vital to countless studies. Our view of the stars, our galaxy, and their histories will only continue to sharpen in years to come.
About Monica Young
Monica Young, a professional astronomer by training, is News Editor of Sky & Telescope.


Comments
jacobus-nl
June 14, 2022 at 4:35 am
Gaia does not produce beautiful pictures like Hubble does, but what an astonishing mission it is!
Minor correction: the article states that Gaia observes the stars “as Earth moves through its 93-million-mile (150-million-km) orbit around the Sun.” The number corresponds to Earth’s distance to the Sun, its orbit is 584 million miles (942 million km). (Note to Gaia team: please double-check all calculations!) 😉
You must be logged in to post a comment.
Monica YoungPost Author
June 15, 2022 at 11:44 am
Correct, and thanks for the note! We'll update the text.
You must be logged in to post a comment.
Martian-Bachelor
June 28, 2022 at 4:57 pm
> Gaia does not produce beautiful pictures like Hubble does,
Though they're a different kind of picture, those all-sky diagrams showing the results qualify as beautiful IME. I second the "astonishing" designation.
You must be logged in to post a comment.
You must be logged in to post a comment.