 3
3A multi-year investigation revealed errors in our understanding of the Sun.
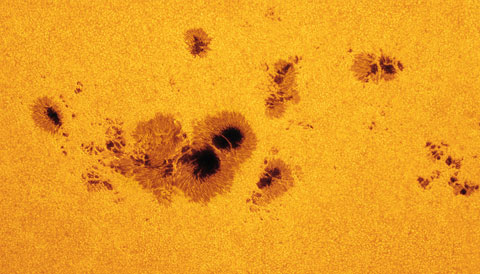
Alan Friedman / Flickr
In 1847, at a small observatory in Bern, Switzerland, a man named Rudolf Wolf started counting sunspots. He worked diligently, peering through a telescope every day, if he could, and recording the number of spots he observed. Curious about how the number of sunspots varied over time, he later compiled all the sunspot data he could find, going back to the year 1700.
It turned out to be one of the most important records of all time.
Today, all sorts of models use this record to predict things like the climate, the orbit of satellites, and the stability of power grids. One solar physicist I work with says that, other than the Dow Jones Industrial Average, the sunspot number is the most relied-upon index in modern society.
Wolf’s record is called the International Sunspot Number. The Sunspot Index and Long-term Solar Observations (SILSO) group, based at the Royal Observatory in Belgium, continues to compute it to this day. But last summer, SILSO announced a brand-new sunspot record — and, in doing so, broke a 150-year old tradition.
To find out why, we begin at the beginning.
Seeing Spots
Back when Wolf started counting sunspots, he understood that two people could look through the same telescope and see two different things. Human vision, after all, isn’t a totally consistent tool. Therefore, he came up with the idea of not only counting sunspots, but also groups of sunspots. Sunspots often cluster in families, called sunspot groups. He figured tallying the groups would make for a more accurate representation of the Sun — since 25 sunspots could mean 25 tiny ones distributed all over the place, or 25 spots in a giant cluster. So he came up with a formula like this:
sunspot number = k(10G + s),
where G is the number of groups, s is the number of individual spots (all of them, including the ones in groups), and k is some factor given to each observer based on how good their vision is.
Wolf eventually moved from Bern to the Observatory of Zürich, where he passed his spot-counting method on to generations of observers. In 1981, SILSO assumed official responsibility for computing the sunspot number.
Fast forward to 1998, when two solar physicists named Douglas Hoyt and Kenneth Schatten came up with their own way of counting sunspots, using historical data from observatories all over the world. Wolf’s sunspot number record had been known to be gappy — drawing criticism as early as 1873 — with several years including only a couple of days of observations. Hoyt and Schatten hoped all their extra data would make for a more robust and less error-prone index. But Hoyt and Schatten’s results ended up differing wildly from Wolf’s results. Further, the solar physics community was split on whose method was correct, adding more fuel to the fire.
Given this state of affairs, a group of solar physicists led by my colleague Leif Svalgaard decided to get together and try to solve the problem. In 2011, they gathered for the first of four Sunspot Number Workshops that culminated in 2014. During that time, they discovered both groups were wrong.
Shoe-leather Investigation
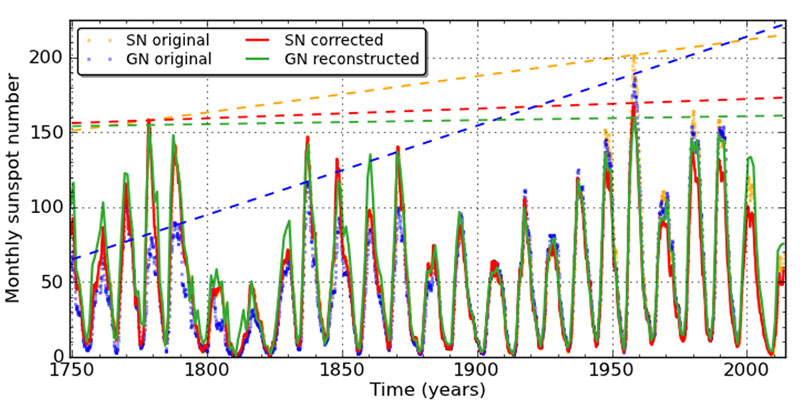
Frédéric Clette et al. / Space Science Reviews 2014
One of the things they found was an oddity in the Zürich Observatory’s sunspot index: it jumped sharply, by about 20%, in 1947. Curious, they searched for anybody who knew what was going on at the Zürich Observatory during that time. Finally, they found a clue near the small Italian-speaking town of Locarno.
There, they spoke to Sergio Cortesi, who still counts sunspots at a tiny observatory called the Specola Solare Ticinese. Cortesi knew that Max Waldmeier, who directed the Zürich Observatory in the 1940s, had started multiplying big sunspots by a factor of 5. Worse, Waldmeier didn’t re-calibrate the old data. This change propagated forward in time.
But that only accounted for one of many discrepancies between the rival sunspot series.
There are a lot of problems with comparing sunspot records. Records are spotty. Human eyes degenerate over time. Different observatories, in different locations, have different seeing. And people have different definitions of what a sunspot really is. Now, with space-based telescopes, like those on the Solar Dynamics Observatory, and image-processing tools, we can define exactly what a sunspot is. But then, such things were impossible.
It is possible, however, to compare contemporaneous records: multiple observatories, observing at the same time, should see the same thing. If, for example, an observatory in one place sees consistently fewer spots than an observatory in another location, then we can multiply the first series by a factor to make it match the second. That’s what Hoyt and Schatten did: they calibrated all the historical indices to one taken by the Royal Observatory in Greenwich, in the United Kingdom. But the Sunspot Number Workshop group found flaws in the Greenwich series — the ratio between the sunspot number, s, and the group number, G, suspiciously increased between 1875 and 1915, only to remain flat again later — that undermined Hoyt and Schatten’s entire analysis.
The Waldmeier jump and the Royal Observatory drift were two of several major discoveries by the Sunspot Number Workshop group. They discovered other inaccuracies as well, and fixed them all. The new SILSO sunspot data are, according to the team, fairly robust from the year 1750 forward. They also fit well with other measurements of solar variability.
The index isn’t merely a matter of good record-keeping: it directly bears on solar science. For example, one of the revelations brought about by these fixes is that, contrary to what solar physicists had thought, solar activity has been relatively steady since the 1700s. That in turn changes how we think the Sun has been influencing solar weather and Earth’s climate.
It was a great investigation, but one that isn’t finished yet. Furthermore, not everybody agrees on the new index. Because the new version unequivocally disproves the idea that the Sun has been getting progressively hotter over time, a number of the climate-change scientists who pin global warming on a hotter Sun oppose the new index. It will take time, and a few more debates, before everybody agrees on a sunspot index. So we better hang on to those old, hand-written notebooks from hundreds of years ago. They may help us figure out what the Sun will do tomorrow.
Monica Bobra is a solar physicist at Stanford University and a former S&T intern.
References:
Frédéric Clette et al. "Revisiting the Sunspot Number. A 400-Year Perspective on the Solar Cycle." Space Science Reviews, vol. 186, issue 1-4, pp. 35-103.
Frédéric Clette et al. "Revision of the Sunspot Number(s)." Space Weather. vol. 13, issue 9.
Frédéric Clette et al. "The revised Brussels-Locarno Sunspot Number (1981-2015)." Posted to arXiv.org July 28, 2015.
Douglas V. Hoyt and Kenneth H. Schatten. "Group Sunspot Numbers: A New Solar Activity Reconstruction." Solar Physics, vol. 179, issue 1, pp. 189-219.
Douglas V. Hoyt and Kenneth H. Schatten. The Role of the Sun in Climate Change. Oxford University Press, 1997.


Comments
Anthony Barreiro
February 16, 2016 at 4:22 pm
From the last paragraph of Dr. Bobra's article:
"Because the new version unequivocally disproves the idea that the Sun has been getting progressively hotter over time, a number of the climate-change scientists who pin global warming on a hotter Sun oppose the new index."
If someone "opposes" a careful data analysis because the results disagree with their politically convenient hypothesis, I wouldn't call that person a scientist.
You must be logged in to post a comment.
February 16, 2016 at 8:45 pm
But if someone disagrees with the data analysis on specific scientifically argued grounds then they would not be acting politically but rather would be engaging in the scientific process and debate. And, since Monica did not quote anyone specifically, or provide any references, the statement that the unknown 'some' are pinning their hopes on a 'hotter sun' is entirely unsubstantiated and worse still, ignores the very real and ongoing debate regarding the methodology that was used in this particular research. To sum up, the article was OK until Monica herself inserted that red herring.
You must be logged in to post a comment.
John
February 21, 2016 at 6:16 pm
Here we go again - let's adjust the data to fit the hypotheses...
You must be logged in to post a comment.
You must be logged in to post a comment.