 10
10The coming months will test a new prediction that — contrary to most expectations — forecasts one of the strongest solar cycles on record.
NASA
Now that we’ve passed the longest night of the year, many are eager to see the Sun — and astronomers are among them. Every clear day, solar astronomers image the face of the Sun, counting up the dark spots they see there. And a new prediction says they’ll see far more in the coming months and years than they expected. But whether that prediction holds remains to be seen.
Space Weather Forecast
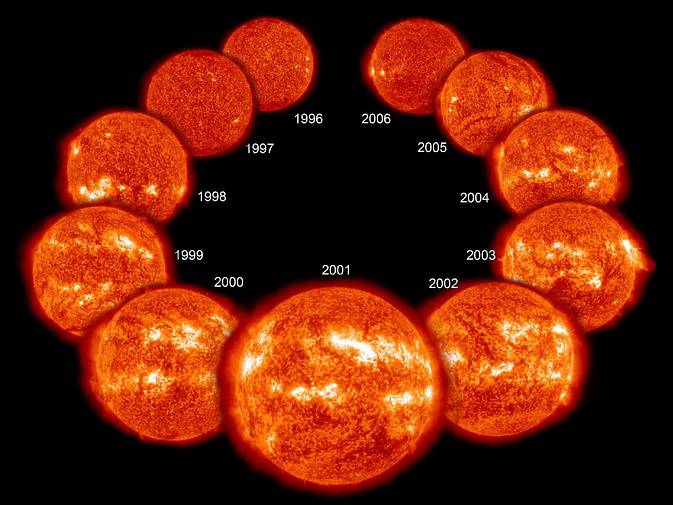
Sunspots are part of an 11-year up-and-down cycle observed since 1610, “one of the oldest data sets that humans have created,” says Dean Pesnell (NASA Goddard), a solar cycle expert. The sunspot cycle is itself just half of the complete magnetic cycle, called the Hale cycle, in which the Sun’s magnetic-field changes come full circle over a period of 22 years.
Just a few months ago, an expert panel of scientists at NASA and the National Oceanic and Atmospheric Administration announced that the beginning of Cycle 25 had occurred in December 2019. That means we’ve hit bottom on sunspot number and are on our way back up, and with sunspots will come all sorts of other magnetically driven activity, like solar eruptions and flares.
But while the timing of the sunspot cycle is relatively predictable, its magnitude isn’t. “The regular up and down in count of sunspot number rarely repeats itself,” Pesnell explains. The inherent turbulence and chaotic nature of the Sun's dynamo makes predicting its behavior difficult at best. In the end, the panel supported physics-based models, which predict Cycle 25's activity will be similar to the surprisingly weak Cycle 24, peaking around July 2025 with some 115 sunspots per month.
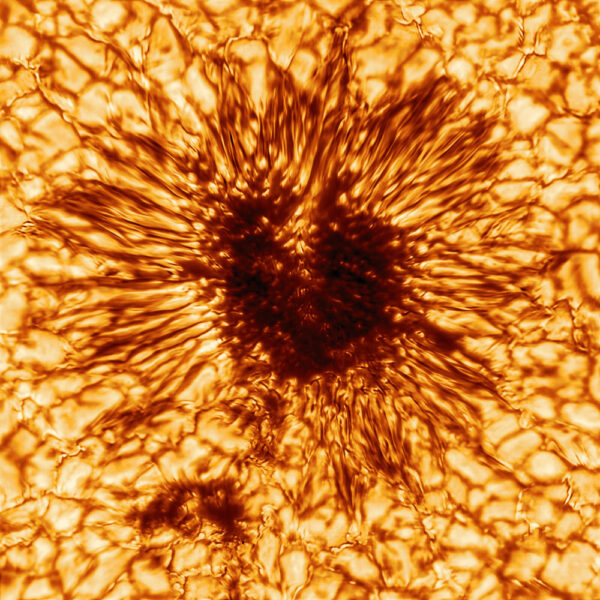
NSO / AURA / NSF
A New Prediction: Termination Events
A consensus is useful for planning purposes, particularly for those who run power grids or launch satellites to low-Earth orbit. For scientists, though, the consensus serves primarily as a point of reference. Because it doesn’t mean that theorists are all done making predictions — far from it!
Indeed, Scott McIntosh (National Center for Atmospheric Research) and colleagues know that they’re going against the consensus when they write, “Sunspot Cycle 25 could have a magnitude that rivals the top few since records began.”
They arrive at this conclusion by analyzing 270 years of sunspot numbers. Using a mathematical technique, they realized that every 22-year Hale cycle terminates markedly and quite quickly, “in a quite astonishing time for a star,” McIntosh says. They call these endings termination events.
What’s more, the timing of the cycle’s termination event seems to correlate with the magnitude of the next sunspot cycle. If that correlation holds, McIntosh and colleagues say that the previous cycle’s brevity means a strong Cycle 25, surpassing 180 sunspots per month at peak. This prediction differs so much from the consensus that we won’t have to wait years, just months to see which one is holding true.

Scott McIntosh / UCAR
Not everybody’s laying bets on this one, though. “The fact that their prediction gives a result outside the bounds of any other cycle says that they are obviously pushing the method into areas it has never covered — extrapolating results into unknown territory,” says David Hathaway (Stanford University), who was not involved in the study. Testing the method on earlier cycles to see how well it performed then would have provided more convincing evidence, he explains.
What We'll Learn
The study is emblematic of the ongoing debate in solar cycle prediction, which has become “a high-stakes event,” McIntosh and colleagues write. There are dozens of models that predict solar activity, some of them based on simulations of the physics involved and some of them based on the Sun's own past performances. Some even use neural networks to forecast future sunspot counts.
Upon examining the last cycle, panel co-chair Lisa Upton (Space Systems Research Corporation), says that she and the others on the panel recognized the advantage of physics-based models, particularly those that use measurements of the magnetic field at the Sun’s poles as an input to their models. These polar fields appear to be the “seeds” of the magnetic activity over the next cycle. “We weighted those forecasts more highly,” she says. “All of us really felt like these physics-based models had the highest accuracy.”
The suspicion that these polar fields are a strong factor in determining the Sun's overall activity is one of the driving forces behind Solaris, a NASA mission recently selected for concept study. Solaris would provide never-before-seen views of the Sun's poles (though the European Space Agency's Solar Orbiter will provide oblique views of the poles in 2025).
So, what if Cycle 25 ends up being strong? “If Cycle 25 does indeed grow significantly beyond that of Cycle 24, then we'll have to reconsider how polar fields contribute to the global evolution of the Sun's magnetism and the dynamo process,” McIntosh says. “It is a real crossroads.”
Regardless what the Sun does over the next few months, we’ll learn something about the inner workings of this fierce dynamo.
About Monica Young
Monica Young, a professional astronomer by training, is News Editor of Sky & Telescope.


Comments
Swmcintosh
December 23, 2020 at 12:41 pm
Thanks Monica.
Just want to point out to our colleague that the article very clearly discusses application to past cycles, see specifically Fig 5: https://link.springer.com/article/10.1007/s11207-020-01723-y
“Furthermore, the red dots in the plot are reconstructions, or a hindcast, of the solar maximum amplitudes given only the measured values of Δ and the relationship derived above...”
“...the recovery of the sunspot maxima is very encouraging although we note that it appears to systematically _underestimate_ the larger amplitude sunspot cycles.”
Let’s see what the Sun has to say!
You must be logged in to post a comment.
Andrew James
December 24, 2020 at 2:49 am
In the prediction of Cycle 24, the question was posed "What’s the main difference between the big (140) and small (90) predictions?" The vote was 6 to 5 for smaller values. A lot rides with the prediction for manned spaceflight in 2024 to 2027. If 180 were true lunar exploration might be far more risky. If it does then it would rival or equal the mid-1950s - not a good year - and luckily no one then was in space. On the other hand, aurora spotters might be in for a treat, even at low geomagnetic latitudes.
Readers should pursue the NOAA website 'Solar Cycle 24 Prediction Updated May 2009.' and the various links there. [https://www.swpc.noaa.gov/content/solar-cycle-24-prediction-updated-may-2009] It shows how diabolical accessing Cycle 25 might be. Scott McIntosh's comment: "Let’s see what the Sun has to say!" leaves space weather experts quite nervous.
I read part of this paper, and it will be interesting who else supports the hypothesis!
You must be logged in to post a comment.
Anthony Barreiro
December 24, 2020 at 4:57 pm
Is there a way to slow down the circular animation of the Sun's magnetic field over the course of the Hale cycle? It flies through 22 years way too fast for me to understand what is going on.
You must be logged in to post a comment.
Andrew James
December 24, 2020 at 5:24 pm
Download the animated gif, then just look at the 80 individual images. Else upload this to a on-line GIF animation speed changer. e.g. Ezgif
You must be logged in to post a comment.
Anthony Barreiro
December 24, 2020 at 7:52 pm
Thank you.
You must be logged in to post a comment.
robertgregory
December 26, 2020 at 11:58 am
Interestingly enough (to me anyway). In solar cycle 24, I think the last large sunspot group to appear (aligning with what McIntosh stated "Using a mathematical technique, they realized that every 22-year Hale cycle terminates markedly and quite quickly") before the sun went completely quiet, was about 9 days after the 2017 Great American Eclipse. And like McIntosh said, "quite quickly" there were no more (at least visible) for about two years..
You must be logged in to post a comment.
Andrew James
December 30, 2020 at 4:02 pm
This NOAA solar cycle sunspot progression at [https://www.swpc.noaa.gov/products/solar-cycle-progression site is very useful.
You must be logged in to post a comment.
Andrew James
December 30, 2020 at 4:05 pm
The NOAA value 180 is very high compared to 115 occurring in July 2025 (same value as Cycle 24) If anything, Cycle 1 to 6 looks like 20 to 24, with 25 and looks similar to Cycle 6.
You must be logged in to post a comment.
Steven Yaskell
January 2, 2021 at 1:22 pm
In 2008, the helioseismological "rush to the equator" activity hadn't started until much later than it should have for ultimately weak sun cycle 24 - even if the opposite-polarity sunspots had been surface-ally noted before this (i.e., the new cycle -24- had magnetically begun). This "rush to the equator" phenomena was noted as absent in the unipolar (top) regions of the sun in 2008, where the sunspot "jet stream" action helioseismologically precedes "sunspot formation" (the Carrington Cycle mid-latitudinal spread). It had not. As we observed, the Carrington Cycle of the bubbly-brown chain of spots was absent for cycle 24 (note: S&T News Notes Vol 122 # 3 pp-12-13/ Jay Pasachoff on this matter, with maps provided) . In coming "strong cycles" like 25 ought to be / is prayed for (to obviate Dalton Minimum sub-catastrophe), that "rush to the equator" should've begun (when 25 was formally accepted as having begun). One could investigate and see if the "physics models" used to make the current weak-coming cycle model included this parameter. If not, then this prediction by NCAR is as valid as any, As they note: "let's see what the sun does." Given the fact that the Parker Probe has recently discovered entirely new physics, since it started recording solar behavior where it should be discovered (i.e., as close as possible to the object) - anything goes. Any result is going to add to knowledge of safety precautions regarding near-earth space exploration.
You must be logged in to post a comment.
Andrew James
January 2, 2021 at 4:25 pm
The follow up paper "Deciphering Solar Magnetic Activity. II. The Solar Cycle Clock and the Onset of Solar Minimum Conditions." arXiv:2012.15186 on 1st Jan 2021 discusses this story in more detail.
You must be logged in to post a comment.
You must be logged in to post a comment.